
|
DCF -Bewertung der DCF -Bewertung von Trinity Place Holdings Inc. (TPHS) |
Fully Editable: Tailor To Your Needs In Excel Or Sheets
Professional Design: Trusted, Industry-Standard Templates
Investor-Approved Valuation Models
MAC/PC Compatible, Fully Unlocked
No Expertise Is Needed; Easy To Follow
Trinity Place Holdings Inc. (TPHS) Bundle
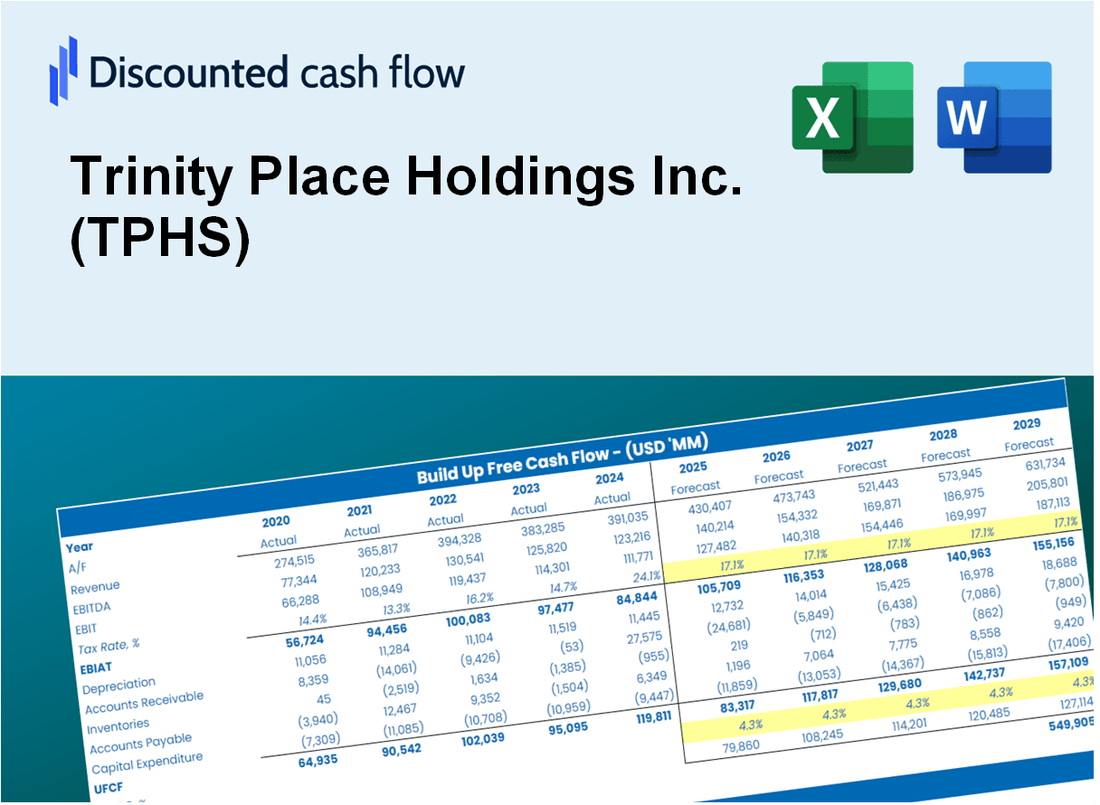
Möchten Sie den intrinsischen Wert von Trinity Place Holdings Inc. (TPHS) bewerten? Unser (TPHS) DCF-Rechner integriert reale Daten mit umfangreichen Anpassungsoptionen, sodass Sie Prognosen anpassen und fundiertere Investitionsentscheidungen treffen können.
What You Will Get
- Real Trinity Place Data: Preloaded financials – from revenue to EBIT – based on actual and projected figures for Trinity Place Holdings Inc. (TPHS).
- Full Customization: Adjust all critical parameters (yellow cells) such as WACC, growth %, and tax rates to fit your analysis.
- Instant Valuation Updates: Automatic recalculations to assess the impact of changes on Trinity Place's fair value.
- Versatile Excel Template: Designed for quick edits, scenario testing, and detailed projections specific to Trinity Place Holdings Inc. (TPHS).
- Time-Saving and Accurate: Eliminate the need to build models from scratch while ensuring accuracy and flexibility.
Key Features
- 🔍 Real-Life TPHS Financials: Pre-filled historical and projected data for Trinity Place Holdings Inc. (TPHS).
- ✏️ Fully Customizable Inputs: Adjust all critical parameters (yellow cells) like WACC, growth %, and tax rates.
- 📊 Professional DCF Valuation: Built-in formulas calculate Trinity Place Holdings’ intrinsic value using the Discounted Cash Flow method.
- ⚡ Instant Results: Visualize Trinity Place Holdings’ valuation instantly after making changes.
- Scenario Analysis: Test and compare outcomes for various financial assumptions side-by-side.
How It Works
- Step 1: Download the Excel file.
- Step 2: Review pre-entered Trinity Place Holdings Inc. (TPHS) data (historical and projected).
- Step 3: Adjust key assumptions (yellow cells) based on your analysis.
- Step 4: View automatic recalculations for Trinity Place Holdings Inc. (TPHS)’s intrinsic value.
- Step 5: Use the outputs for investment decisions or reporting.
Why Choose This Calculator for Trinity Place Holdings Inc. (TPHS)?
- Designed for Experts: A sophisticated tool utilized by investors, financial analysts, and portfolio managers.
- Accurate Financials: Trinity Place Holdings Inc.’s historical and anticipated financial data preloaded for precision.
- Flexible Scenario Analysis: Effortlessly test various forecasts and assumptions.
- Comprehensive Outputs: Instantly computes intrinsic value, NPV, and essential financial metrics.
- User-Friendly: Step-by-step guidance to navigate through the calculations seamlessly.
Who Should Use This Product?
- Investors: Evaluate Trinity Place Holdings Inc. (TPHS)’s market position before making investment decisions.
- CFOs and Financial Analysts: Optimize valuation methods and assess financial forecasts for better accuracy.
- Startup Founders: Understand the valuation strategies of established companies like Trinity Place Holdings Inc. (TPHS).
- Consultants: Provide detailed valuation analyses and reports to enhance client services.
- Students and Educators: Utilize current data to learn and teach effective valuation practices.
What the Template Contains
- Pre-Filled DCF Model: Trinity Place Holdings Inc.'s (TPHS) financial data preloaded for immediate use.
- WACC Calculator: Detailed calculations for Weighted Average Cost of Capital.
- Financial Ratios: Evaluate Trinity Place Holdings Inc.'s (TPHS) profitability, leverage, and efficiency.
- Editable Inputs: Change assumptions such as growth, margins, and CAPEX to fit your scenarios.
- Financial Statements: Annual and quarterly reports to support detailed analysis.
- Interactive Dashboard: Easily visualize key valuation metrics and results.
Disclaimer
All information, articles, and product details provided on this website are for general informational and educational purposes only. We do not claim any ownership over, nor do we intend to infringe upon, any trademarks, copyrights, logos, brand names, or other intellectual property mentioned or depicted on this site. Such intellectual property remains the property of its respective owners, and any references here are made solely for identification or informational purposes, without implying any affiliation, endorsement, or partnership.
We make no representations or warranties, express or implied, regarding the accuracy, completeness, or suitability of any content or products presented. Nothing on this website should be construed as legal, tax, investment, financial, medical, or other professional advice. In addition, no part of this site—including articles or product references—constitutes a solicitation, recommendation, endorsement, advertisement, or offer to buy or sell any securities, franchises, or other financial instruments, particularly in jurisdictions where such activity would be unlawful.
All content is of a general nature and may not address the specific circumstances of any individual or entity. It is not a substitute for professional advice or services. Any actions you take based on the information provided here are strictly at your own risk. You accept full responsibility for any decisions or outcomes arising from your use of this website and agree to release us from any liability in connection with your use of, or reliance upon, the content or products found herein.