
|
DCF -Bewertung der Terreno Realty Corporation (TRNO) |
Fully Editable: Tailor To Your Needs In Excel Or Sheets
Professional Design: Trusted, Industry-Standard Templates
Investor-Approved Valuation Models
MAC/PC Compatible, Fully Unlocked
No Expertise Is Needed; Easy To Follow
Terreno Realty Corporation (TRNO) Bundle
Entdecken Sie die finanziellen Aussichten der Terreno Realty Corporation (TRNO) mit unserem benutzerfreundlichen DCF-Taschenrechner! Geben Sie Ihre Prognosen für Wachstum, Margen und Ausgaben ein, um den inneren Wert der Terreno Realty Corporation (TRNO) zu bestimmen und Ihre Anlagestrategie zu verbessern.
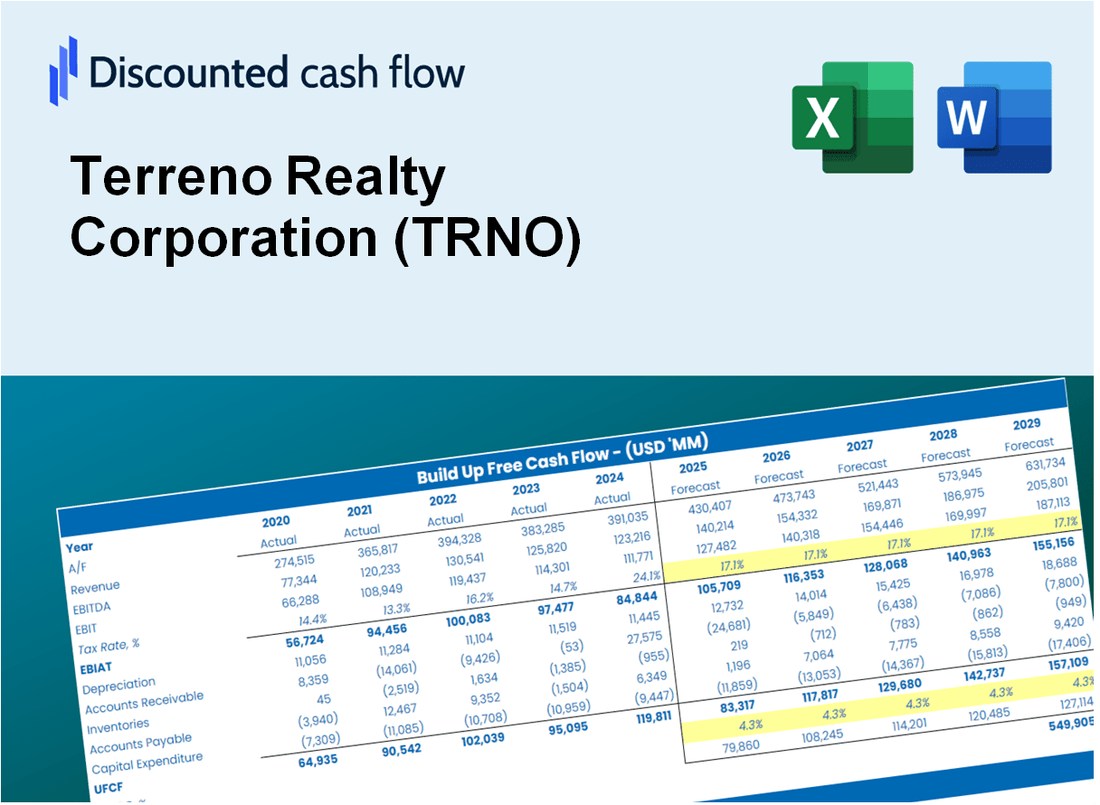
Discounted Cash Flow (DCF) - (USD MM)
| Year | AY1 2020 |
AY2 2021 |
AY3 2022 |
AY4 2023 |
AY5 2024 |
FY1 2025 |
FY2 2026 |
FY3 2027 |
FY4 2028 |
FY5 2029 |
|---|---|---|---|---|---|---|---|---|---|---|
| Revenue | 186.9 | 221.9 | 276.2 | 323.6 | 382.6 | 457.8 | 547.8 | 655.4 | 784.2 | 938.3 |
| Revenue Growth, % | 0 | 18.75 | 24.46 | 17.15 | 18.24 | 19.65 | 19.65 | 19.65 | 19.65 | 19.65 |
| EBITDA | 141.7 | 156.0 | 287.6 | 249.5 | 299.3 | 367.6 | 439.8 | 526.2 | 629.6 | 753.3 |
| EBITDA, % | 75.8 | 70.29 | 104.13 | 77.1 | 78.23 | 80.28 | 80.28 | 80.28 | 80.28 | 80.28 |
| Depreciation | 118.7 | 50.7 | 65.8 | 73.2 | 93.9 | 144.1 | 172.4 | 206.3 | 246.8 | 295.3 |
| Depreciation, % | 63.53 | 22.84 | 23.81 | 22.63 | 24.55 | 31.47 | 31.47 | 31.47 | 31.47 | 31.47 |
| EBIT | 22.9 | 105.3 | 221.9 | 176.3 | 205.4 | 227.3 | 271.9 | 325.4 | 389.3 | 465.8 |
| EBIT, % | 12.27 | 47.45 | 80.32 | 54.47 | 53.69 | 49.64 | 49.64 | 49.64 | 49.64 | 49.64 |
| Total Cash | 107.2 | 204.4 | 26.4 | 165.4 | 18.1 | 196.7 | 235.4 | 281.6 | 337.0 | 403.2 |
| Total Cash, percent | .0 | .0 | .0 | .0 | .0 | .0 | .0 | .0 | .0 | .0 |
| Account Receivables | .0 | .0 | .0 | .0 | 62.9 | 15.1 | 18.0 | 21.5 | 25.8 | 30.9 |
| Account Receivables, % | 0 | 0 | 0 | 0 | 16.44 | 3.29 | 3.29 | 3.29 | 3.29 | 3.29 |
| Inventories | .0 | .0 | .0 | .0 | .0 | .0 | .0 | .0 | .0 | .0 |
| Inventories, % | 0 | 0 | 0 | 0 | 0 | 0 | 0 | 0 | 0 | 0 |
| Accounts Payable | 26.7 | 45.0 | 49.7 | 61.8 | 79.2 | 84.6 | 101.2 | 121.1 | 144.9 | 173.3 |
| Accounts Payable, % | 14.28 | 20.29 | 17.99 | 19.09 | 20.7 | 18.47 | 18.47 | 18.47 | 18.47 | 18.47 |
| Capital Expenditure | -31.6 | -51.3 | -66.6 | -53.1 | -46.4 | -84.9 | -101.5 | -121.5 | -145.4 | -173.9 |
| Capital Expenditure, % | -16.91 | -23.11 | -24.12 | -16.4 | -12.14 | -18.53 | -18.53 | -18.53 | -18.53 | -18.53 |
| Tax Rate, % | 0 | 0 | 0 | 0 | 0 | 0 | 0 | 0 | 0 | 0 |
| EBITAT | 16.8 | 105.3 | 221.9 | 176.3 | 205.4 | 215.1 | 257.3 | 307.9 | 368.4 | 440.8 |
| Depreciation | ||||||||||
| Changes in Account Receivables | ||||||||||
| Changes in Inventories | ||||||||||
| Changes in Accounts Payable | ||||||||||
| Capital Expenditure | ||||||||||
| UFCF | 130.6 | 123.0 | 225.7 | 208.5 | 207.4 | 327.5 | 341.8 | 409.0 | 489.4 | 585.6 |
| WACC, % | 8.35 | 8.47 | 8.47 | 8.47 | 8.47 | 8.45 | 8.45 | 8.45 | 8.45 | 8.45 |
| PV UFCF | ||||||||||
| SUM PV UFCF | 1,657.6 | |||||||||
| Long Term Growth Rate, % | 4.00 | |||||||||
| Free cash flow (T + 1) | 609 | |||||||||
| Terminal Value | 13,699 | |||||||||
| Present Terminal Value | 9,133 | |||||||||
| Enterprise Value | 10,791 | |||||||||
| Net Debt | 805 | |||||||||
| Equity Value | 9,985 | |||||||||
| Diluted Shares Outstanding, MM | 96 | |||||||||
| Equity Value Per Share | 104.19 |
What You Will Receive
- Customizable Excel Template: A fully adjustable Excel-based DCF Calculator featuring pre-filled real TRNO financials.
- Actual Market Data: Historical performance and projected estimates (highlighted in the yellow cells).
- Assumption Flexibility: Modify forecast parameters such as revenue growth, EBITDA %, and WACC.
- Instant Calculations: Quickly observe how your inputs affect Terreno Realty's valuation.
- Professional Resource: Designed for investors, CFOs, consultants, and financial analysts.
- Intuitive Layout: Organized for simplicity and user-friendliness, complete with step-by-step guidance.
Key Features
- Comprehensive DCF Calculator: Offers detailed unlevered and levered DCF valuation models tailored for Terreno Realty Corporation (TRNO).
- WACC Calculator: Features a pre-built Weighted Average Cost of Capital sheet with adjustable inputs for precise calculations.
- Customizable Forecast Assumptions: Easily modify growth rates, capital expenditures, and discount rates to fit your analysis.
- Integrated Financial Ratios: Evaluate profitability, leverage, and efficiency ratios specific to Terreno Realty Corporation (TRNO).
- Interactive Dashboard and Charts: Visual representations of key valuation metrics facilitate straightforward analysis.
How It Works
- Step 1: Download the Excel file.
- Step 2: Review Terreno Realty Corporation’s (TRNO) pre-filled financial data and forecasts.
- Step 3: Modify key inputs such as rental income growth, cap rates, and operating expenses (highlighted cells).
- Step 4: Observe the DCF model update in real-time as you adjust your assumptions.
- Step 5: Evaluate the outputs and leverage the results for your investment strategies.
Why Choose This Calculator for Terreno Realty Corporation (TRNO)?
- Accuracy: Utilizes real Terreno Realty financials to ensure precise data.
- Flexibility: Built for users to freely test and adjust inputs as needed.
- Time-Saving: Eliminate the complexity of creating a DCF model from the ground up.
- Professional-Grade: Crafted with the precision and usability expected by CFOs.
- User-Friendly: Intuitive design makes it accessible for users without advanced financial modeling skills.
Who Should Use This Product?
- Real Estate Students: Understand property valuation methods and apply them using real market data.
- Researchers: Utilize industry-specific models for academic projects or studies.
- Investors: Evaluate your investment strategies and assess valuation metrics for Terreno Realty Corporation (TRNO).
- Financial Analysts: Enhance your analysis with a customizable DCF model tailored for real estate.
- Property Developers: Discover insights into how publicly traded real estate companies like Terreno Realty Corporation (TRNO) operate.
What the Template Contains
- Operating and Balance Sheet Data: Pre-filled Terreno Realty Corporation (TRNO) historical data and forecasts, including revenue, EBITDA, EBIT, and capital expenditures.
- WACC Calculation: A dedicated sheet for Weighted Average Cost of Capital (WACC), including parameters like Beta, risk-free rate, and share price.
- DCF Valuation (Unlevered and Levered): Editable Discounted Cash Flow models showing intrinsic value with detailed calculations.
- Financial Statements: Pre-loaded financial statements (annual and quarterly) to support analysis.
- Key Ratios: Includes profitability, leverage, and efficiency ratios for Terreno Realty Corporation (TRNO).
- Dashboard and Charts: Visual summary of valuation outputs and assumptions to analyze results easily.
Disclaimer
All information, articles, and product details provided on this website are for general informational and educational purposes only. We do not claim any ownership over, nor do we intend to infringe upon, any trademarks, copyrights, logos, brand names, or other intellectual property mentioned or depicted on this site. Such intellectual property remains the property of its respective owners, and any references here are made solely for identification or informational purposes, without implying any affiliation, endorsement, or partnership.
We make no representations or warranties, express or implied, regarding the accuracy, completeness, or suitability of any content or products presented. Nothing on this website should be construed as legal, tax, investment, financial, medical, or other professional advice. In addition, no part of this site—including articles or product references—constitutes a solicitation, recommendation, endorsement, advertisement, or offer to buy or sell any securities, franchises, or other financial instruments, particularly in jurisdictions where such activity would be unlawful.
All content is of a general nature and may not address the specific circumstances of any individual or entity. It is not a substitute for professional advice or services. Any actions you take based on the information provided here are strictly at your own risk. You accept full responsibility for any decisions or outcomes arising from your use of this website and agree to release us from any liability in connection with your use of, or reliance upon, the content or products found herein.