
|
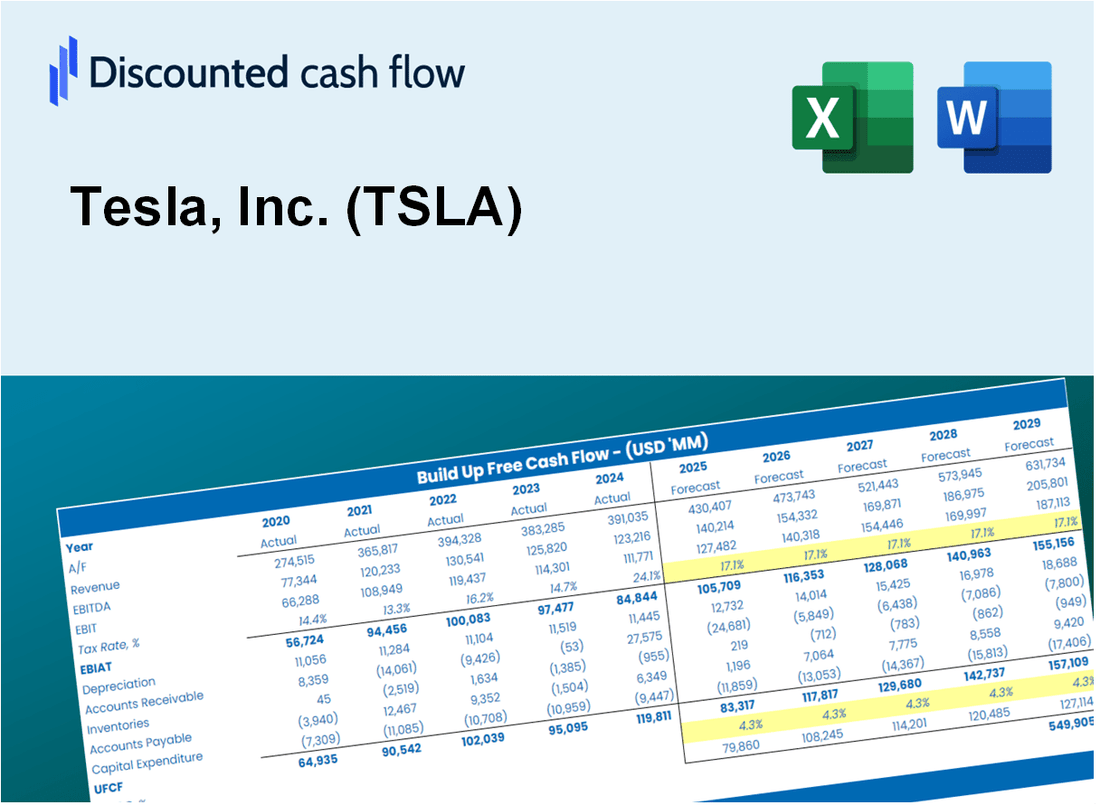
Tesla, Inc. (TSLA) DCF -Bewertung |
Fully Editable: Tailor To Your Needs In Excel Or Sheets
Professional Design: Trusted, Industry-Standard Templates
Investor-Approved Valuation Models
MAC/PC Compatible, Fully Unlocked
No Expertise Is Needed; Easy To Follow
Tesla, Inc. (TSLA) Bundle
Stürzen Sie Ihre Analyse und verbessern Sie die Präzision mit unserem [TSLA] DCF -Taschenrechner! Mithilfe von realen Tesla -Daten und anpassbaren Annahmen können Sie dieses Tool wie ein erfahrener Investor prognostizieren, analysieren und bewerten.
What You Will Receive
- Pre-Filled Financial Model: Tesla’s actual data facilitates accurate DCF valuation.
- Full Forecast Control: Modify revenue growth, profit margins, WACC, and other essential drivers.
- Instant Calculations: Real-time updates provide immediate results as you make adjustments.
- Investor-Ready Template: A polished Excel file crafted for professional-level valuation.
- Customizable and Reusable: Designed for adaptability, allowing repeated use for comprehensive forecasts.
Key Features
- Pre-Loaded Data: Tesla’s historical financial statements and pre-filled forecasts.
- Fully Adjustable Inputs: Edit WACC, tax rates, revenue growth, and EBITDA margins.
- Instant Results: See Tesla’s intrinsic value recalculate in real time.
- Clear Visual Outputs: Dashboard charts display valuation results and key metrics.
- Built for Accuracy: A professional tool for analysts, investors, and finance experts.
How It Works
- Step 1: Download the Excel file.
- Step 2: Review pre-entered Tesla data (historical and projected).
- Step 3: Adjust key assumptions (yellow cells) based on your analysis.
- Step 4: View automatic recalculations for Tesla’s intrinsic value.
- Step 5: Use the outputs for investment decisions or reporting.
Why Choose This Calculator for Tesla, Inc. (TSLA)?
- Accuracy: Utilizes Tesla's actual financials to guarantee data precision.
- Flexibility: Built to allow users to easily test and adjust inputs as needed.
- Time-Saving: Eliminate the complexity of constructing a DCF model from the ground up.
- Professional-Grade: Crafted with the expertise and usability expected by CFOs.
- User-Friendly: Intuitive design makes it accessible for users without extensive financial modeling knowledge.
Who Should Use This Product?
- Investors: Accurately estimate Tesla’s fair value before making investment decisions.
- CFOs: Leverage a professional-grade DCF model for financial reporting and analysis.
- Consultants: Quickly adapt the template for valuation reports for clients.
- Entrepreneurs: Gain insights into financial modeling used by leading automotive companies.
- Educators: Use it as a teaching tool to demonstrate valuation methodologies.
What the Template Contains
- Preloaded TSLA Data: Historical and projected financial data, including revenue, EBIT, and capital expenditures.
- DCF and WACC Models: Professional-grade sheets for calculating intrinsic value and Weighted Average Cost of Capital.
- Editable Inputs: Yellow-highlighted cells for adjusting revenue growth, tax rates, and discount rates.
- Financial Statements: Comprehensive annual and quarterly financials for deeper analysis.
- Key Ratios: Profitability, leverage, and efficiency ratios to evaluate performance.
- Dashboard and Charts: Visual summaries of valuation outcomes and assumptions.
Disclaimer
All information, articles, and product details provided on this website are for general informational and educational purposes only. We do not claim any ownership over, nor do we intend to infringe upon, any trademarks, copyrights, logos, brand names, or other intellectual property mentioned or depicted on this site. Such intellectual property remains the property of its respective owners, and any references here are made solely for identification or informational purposes, without implying any affiliation, endorsement, or partnership.
We make no representations or warranties, express or implied, regarding the accuracy, completeness, or suitability of any content or products presented. Nothing on this website should be construed as legal, tax, investment, financial, medical, or other professional advice. In addition, no part of this site—including articles or product references—constitutes a solicitation, recommendation, endorsement, advertisement, or offer to buy or sell any securities, franchises, or other financial instruments, particularly in jurisdictions where such activity would be unlawful.
All content is of a general nature and may not address the specific circumstances of any individual or entity. It is not a substitute for professional advice or services. Any actions you take based on the information provided here are strictly at your own risk. You accept full responsibility for any decisions or outcomes arising from your use of this website and agree to release us from any liability in connection with your use of, or reliance upon, the content or products found herein.