
|
Tile Shop Holdings, Inc. (TTSH) DCF -Bewertung |
Fully Editable: Tailor To Your Needs In Excel Or Sheets
Professional Design: Trusted, Industry-Standard Templates
Investor-Approved Valuation Models
MAC/PC Compatible, Fully Unlocked
No Expertise Is Needed; Easy To Follow
Tile Shop Holdings, Inc. (TTSH) Bundle
Unabhängig davon, ob Sie ein Investor oder ein Analyst sind, ist dieser (TTSH) DCF-Taschenrechner Ihre Anlaufstelle für eine genaue Bewertung. Mit realen Daten von Tile Shop Holdings, Inc. geladen, können Sie Prognosen anpassen und die Auswirkungen sofort beobachten.
What You Will Receive
- Comprehensive Financial Model: Tile Shop Holdings, Inc. (TTSH)’s real data supports accurate DCF valuation.
- Complete Forecast Flexibility: Modify revenue growth, profit margins, WACC, and other essential factors.
- Real-Time Calculations: Instant updates allow you to view outcomes as you make adjustments.
- Professional-Grade Template: A polished Excel file crafted for high-standard valuation.
- Adaptable and Reusable: Designed for versatility, enabling repeated use for in-depth forecasting.
Key Features
- Comprehensive DCF Calculator: Features detailed unlevered and levered DCF valuation models tailored for Tile Shop Holdings, Inc. (TTSH).
- WACC Calculator: Pre-configured Weighted Average Cost of Capital sheet with adjustable inputs specific to TTSH.
- Customizable Forecast Assumptions: Adjust growth rates, capital expenditures, and discount rates to suit your analysis of TTSH.
- Integrated Financial Ratios: Evaluate profitability, leverage, and efficiency ratios relevant to Tile Shop Holdings, Inc. (TTSH).
- Interactive Dashboard and Charts: Visual representations highlight key valuation metrics for streamlined analysis of TTSH.
How It Works
- Download the Template: Get instant access to the Excel-based TTSH DCF Calculator.
- Input Your Assumptions: Adjust yellow-highlighted cells for growth rates, WACC, margins, and more.
- Instant Calculations: The model automatically updates Tile Shop Holdings' intrinsic value.
- Test Scenarios: Simulate different assumptions to evaluate potential valuation changes.
- Analyze and Decide: Use the results to guide your investment or financial analysis.
Why Choose This Calculator for Tile Shop Holdings, Inc. (TTSH)?
- Comprehensive Tool: Features DCF, WACC, and financial ratio analyses all in one convenient package.
- Customizable Inputs: Modify yellow-highlighted cells to explore different financial scenarios.
- Detailed Insights: Automatically computes Tile Shop Holdings’ intrinsic value and Net Present Value.
- Preloaded Data: Access to historical and projected data ensures reliable starting points.
- Professional Quality: Perfect for financial analysts, investors, and business consultants focusing on TTSH.
Who Should Use Tile Shop Holdings, Inc. (TTSH)?
- Homeowners: Enhance your living spaces with high-quality tiles and design ideas.
- Interior Designers: Access a wide selection of stylish tiles for diverse projects.
- Contractors: Source reliable materials for installations and renovations efficiently.
- DIY Enthusiasts: Find inspiration and resources for your home improvement projects.
- Retailers: Partner with us to offer premium tile products to your customers.
What the Template Contains
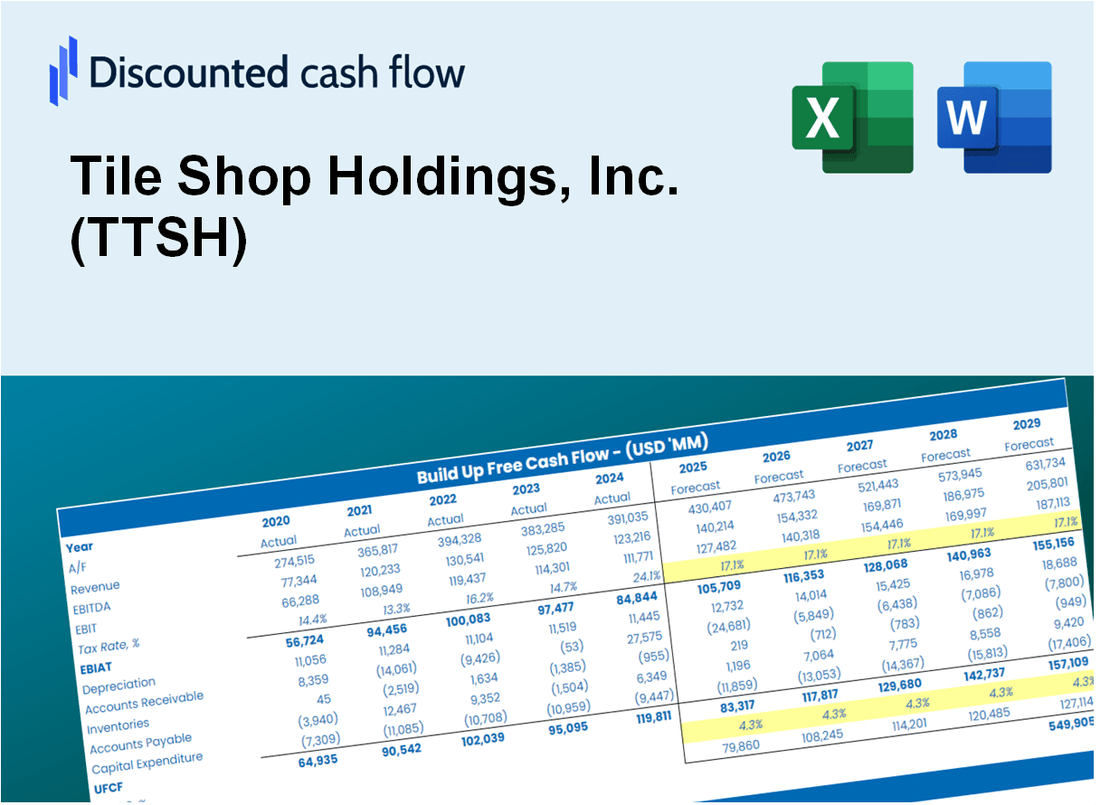
- Operating and Balance Sheet Data: Pre-filled Tile Shop Holdings, Inc. (TTSH) historical data and forecasts, including revenue, EBITDA, EBIT, and capital expenditures.
- WACC Calculation: A dedicated sheet for Weighted Average Cost of Capital (WACC), including parameters like Beta, risk-free rate, and share price.
- DCF Valuation (Unlevered and Levered): Editable Discounted Cash Flow models showing intrinsic value with detailed calculations.
- Financial Statements: Pre-loaded financial statements (annual and quarterly) to support analysis.
- Key Ratios: Includes profitability, leverage, and efficiency ratios for Tile Shop Holdings, Inc. (TTSH).
- Dashboard and Charts: Visual summary of valuation outputs and assumptions to analyze results easily.
Disclaimer
All information, articles, and product details provided on this website are for general informational and educational purposes only. We do not claim any ownership over, nor do we intend to infringe upon, any trademarks, copyrights, logos, brand names, or other intellectual property mentioned or depicted on this site. Such intellectual property remains the property of its respective owners, and any references here are made solely for identification or informational purposes, without implying any affiliation, endorsement, or partnership.
We make no representations or warranties, express or implied, regarding the accuracy, completeness, or suitability of any content or products presented. Nothing on this website should be construed as legal, tax, investment, financial, medical, or other professional advice. In addition, no part of this site—including articles or product references—constitutes a solicitation, recommendation, endorsement, advertisement, or offer to buy or sell any securities, franchises, or other financial instruments, particularly in jurisdictions where such activity would be unlawful.
All content is of a general nature and may not address the specific circumstances of any individual or entity. It is not a substitute for professional advice or services. Any actions you take based on the information provided here are strictly at your own risk. You accept full responsibility for any decisions or outcomes arising from your use of this website and agree to release us from any liability in connection with your use of, or reliance upon, the content or products found herein.