
|
Under Armor, Inc. (UAA) DCF -Bewertung |
Fully Editable: Tailor To Your Needs In Excel Or Sheets
Professional Design: Trusted, Industry-Standard Templates
Investor-Approved Valuation Models
MAC/PC Compatible, Fully Unlocked
No Expertise Is Needed; Easy To Follow
Under Armour, Inc. (UAA) Bundle
Erwerben Sie die Bewertungsanalyse von Under Armor, Inc. (UAA) mit unserem ausgeklügelten DCF -Taschenrechner! Diese Excel -Vorlage mit authentischen (UAA) -Daten (UAA) -Daten vorinstalliert, ermöglicht es Ihnen, Prognosen und Annahmen anzupassen, um den intrinsischen Wert von Under Armor, Inc. genau zu bestimmen.
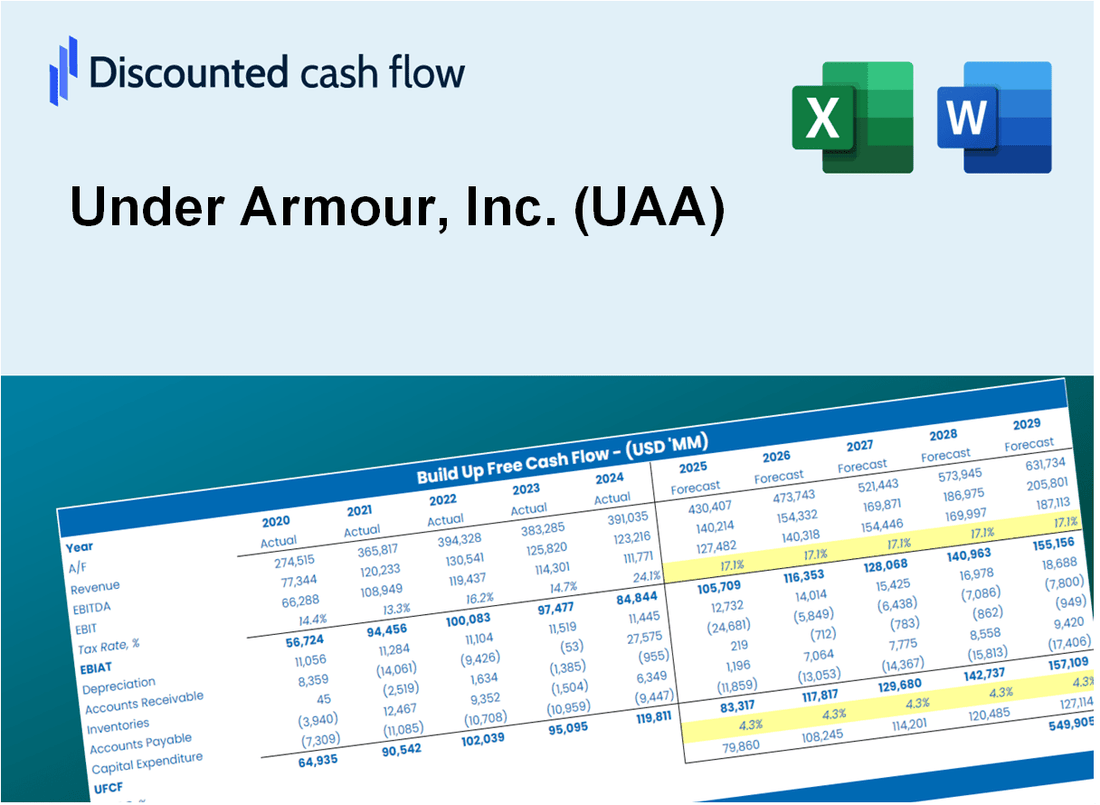
Discounted Cash Flow (DCF) - (USD MM)
| Year | AY1 2021 |
AY2 2022 |
AY3 2023 |
AY4 2024 |
AY5 2025 |
FY1 2026 |
FY2 2027 |
FY3 2028 |
FY4 2029 |
FY5 2030 |
|---|---|---|---|---|---|---|---|---|---|---|
| Revenue | 4,474.7 | 5,683.5 | 5,903.2 | 5,701.9 | 5,164.3 | 5,397.2 | 5,640.7 | 5,895.1 | 6,161.0 | 6,438.9 |
| Revenue Growth, % | 0 | 27.01 | 3.87 | -3.41 | -9.43 | 4.51 | 4.51 | 4.51 | 4.51 | 4.51 |
| EBITDA | 153.1 | 668.0 | 399.0 | 372.3 | 8.6 | 309.1 | 323.0 | 337.6 | 352.8 | 368.7 |
| EBITDA, % | 3.42 | 11.75 | 6.76 | 6.53 | 0.16569 | 5.73 | 5.73 | 5.73 | 5.73 | 5.73 |
| Depreciation | 165.0 | 141.1 | 135.5 | 142.6 | 135.8 | 146.8 | 153.4 | 160.3 | 167.5 | 175.1 |
| Depreciation, % | 3.69 | 2.48 | 2.29 | 2.5 | 2.63 | 2.72 | 2.72 | 2.72 | 2.72 | 2.72 |
| EBIT | -11.8 | 526.8 | 263.6 | 229.8 | -127.2 | 162.3 | 169.6 | 177.3 | 185.3 | 193.6 |
| EBIT, % | -0.26458 | 9.27 | 4.47 | 4.03 | -2.46 | 3.01 | 3.01 | 3.01 | 3.01 | 3.01 |
| Total Cash | 1,517.4 | 1,669.5 | 711.9 | 858.7 | 501.4 | 1,080.7 | 1,129.4 | 1,180.3 | 1,233.6 | 1,289.2 |
| Total Cash, percent | .0 | .0 | .0 | .0 | .0 | .0 | .0 | .0 | .0 | .0 |
| Account Receivables | 527.3 | 569.0 | 758.6 | 757.3 | 675.8 | 658.6 | 688.3 | 719.4 | 751.8 | 785.7 |
| Account Receivables, % | 11.79 | 10.01 | 12.85 | 13.28 | 13.09 | 12.2 | 12.2 | 12.2 | 12.2 | 12.2 |
| Inventories | 896.0 | 811.4 | 1,190.3 | 958.5 | 945.8 | 967.1 | 1,010.7 | 1,056.3 | 1,103.9 | 1,153.7 |
| Inventories, % | 20.02 | 14.28 | 20.16 | 16.81 | 18.31 | 17.92 | 17.92 | 17.92 | 17.92 | 17.92 |
| Accounts Payable | 576.0 | 613.3 | 649.1 | 483.7 | 429.9 | 555.6 | 580.6 | 606.8 | 634.2 | 662.8 |
| Accounts Payable, % | 12.87 | 10.79 | 11 | 8.48 | 8.33 | 10.29 | 10.29 | 10.29 | 10.29 | 10.29 |
| Capital Expenditure | -92.3 | -69.8 | -187.8 | -150.3 | -168.7 | -133.6 | -139.6 | -145.9 | -152.5 | -159.4 |
| Capital Expenditure, % | -2.06 | -1.23 | -3.18 | -2.64 | -3.27 | -2.47 | -2.47 | -2.47 | -2.47 | -2.47 |
| Tax Rate, % | 1.71 | 1.71 | 1.71 | 1.71 | 1.71 | 1.71 | 1.71 | 1.71 | 1.71 | 1.71 |
| EBITAT | -13.2 | 485.3 | 343.0 | 203.4 | -125.1 | 155.5 | 162.5 | 169.8 | 177.5 | 185.5 |
| Depreciation | ||||||||||
| Changes in Account Receivables | ||||||||||
| Changes in Inventories | ||||||||||
| Changes in Accounts Payable | ||||||||||
| Capital Expenditure | ||||||||||
| UFCF | -787.9 | 636.9 | -241.9 | 263.3 | -117.6 | 290.2 | 128.0 | 133.8 | 139.8 | 146.1 |
| WACC, % | 8.74 | 8.62 | 8.74 | 8.57 | 8.71 | 8.68 | 8.68 | 8.68 | 8.68 | 8.68 |
| PV UFCF | ||||||||||
| SUM PV UFCF | 676.2 | |||||||||
| Long Term Growth Rate, % | 3.00 | |||||||||
| Free cash flow (T + 1) | 150 | |||||||||
| Terminal Value | 2,651 | |||||||||
| Present Terminal Value | 1,749 | |||||||||
| Enterprise Value | 2,425 | |||||||||
| Net Debt | 798 | |||||||||
| Equity Value | 1,627 | |||||||||
| Diluted Shares Outstanding, MM | 432 | |||||||||
| Equity Value Per Share | 3.76 |
What You Will Get
- Real UAA Financials: Access to historical and projected data for precise valuation.
- Customizable Inputs: Adjust WACC, tax rates, revenue growth, and capital expenditures as needed.
- Dynamic Calculations: Intrinsic value and NPV are computed in real-time.
- Scenario Analysis: Evaluate various scenarios to assess Under Armour's future performance.
- User-Friendly Design: Designed for professionals while remaining approachable for newcomers.
Key Features
- Comprehensive DCF Calculator: Features detailed unlevered and levered DCF valuation models tailored for Under Armour, Inc. (UAA).
- WACC Calculator: Comes with a pre-structured Weighted Average Cost of Capital sheet that allows for customizable inputs specific to Under Armour, Inc. (UAA).
- Adjustable Forecast Assumptions: Easily modify growth rates, capital expenditures, and discount rates to fit Under Armour, Inc. (UAA).
- Integrated Financial Ratios: Evaluate profitability, leverage, and efficiency ratios for Under Armour, Inc. (UAA).
- Interactive Dashboard and Charts: Visual representations summarize essential valuation metrics for straightforward analysis of Under Armour, Inc. (UAA).
How It Works
- Step 1: Download the Excel file.
- Step 2: Review pre-entered Under Armour data (historical and projected).
- Step 3: Adjust key assumptions (yellow cells) based on your analysis.
- Step 4: View automatic recalculations for Under Armour’s intrinsic value.
- Step 5: Use the outputs for investment decisions or reporting.
Why Choose This Calculator?
- Comprehensive Tool: Features DCF, WACC, and financial ratio analyses all in one convenient package.
- Customizable Inputs: Modify the yellow-highlighted cells to explore different scenarios.
- Detailed Insights: Automatically computes Under Armour’s intrinsic value and Net Present Value.
- Preloaded Data: Historical and projected data provide reliable starting points for analysis.
- Professional Quality: Perfect for financial analysts, investors, and business consultants focusing on Under Armour, Inc. (UAA).
Who Should Use This Product?
- Investors: Evaluate Under Armour's valuation before making stock transactions.
- CFOs and Financial Analysts: Optimize valuation methodologies and assess financial forecasts.
- Startup Founders: Discover how leading brands like Under Armour are appraised in the market.
- Consultants: Provide comprehensive valuation analyses for clients in the sportswear industry.
- Students and Educators: Utilize current data to practice and instruct on valuation strategies.
What the Template Contains
- Preloaded UAA Data: Historical and projected financial data, including revenue, EBIT, and capital expenditures.
- DCF and WACC Models: Professional-grade sheets for calculating intrinsic value and Weighted Average Cost of Capital.
- Editable Inputs: Yellow-highlighted cells for adjusting revenue growth, tax rates, and discount rates.
- Financial Statements: Comprehensive annual and quarterly financials for deeper analysis.
- Key Ratios: Profitability, leverage, and efficiency ratios to evaluate performance.
- Dashboard and Charts: Visual summaries of valuation outcomes and assumptions.
Disclaimer
All information, articles, and product details provided on this website are for general informational and educational purposes only. We do not claim any ownership over, nor do we intend to infringe upon, any trademarks, copyrights, logos, brand names, or other intellectual property mentioned or depicted on this site. Such intellectual property remains the property of its respective owners, and any references here are made solely for identification or informational purposes, without implying any affiliation, endorsement, or partnership.
We make no representations or warranties, express or implied, regarding the accuracy, completeness, or suitability of any content or products presented. Nothing on this website should be construed as legal, tax, investment, financial, medical, or other professional advice. In addition, no part of this site—including articles or product references—constitutes a solicitation, recommendation, endorsement, advertisement, or offer to buy or sell any securities, franchises, or other financial instruments, particularly in jurisdictions where such activity would be unlawful.
All content is of a general nature and may not address the specific circumstances of any individual or entity. It is not a substitute for professional advice or services. Any actions you take based on the information provided here are strictly at your own risk. You accept full responsibility for any decisions or outcomes arising from your use of this website and agree to release us from any liability in connection with your use of, or reliance upon, the content or products found herein.