
|
UFP Industries, Inc. (UFPI) DCF -Bewertung |
Fully Editable: Tailor To Your Needs In Excel Or Sheets
Professional Design: Trusted, Industry-Standard Templates
Investor-Approved Valuation Models
MAC/PC Compatible, Fully Unlocked
No Expertise Is Needed; Easy To Follow
UFP Industries, Inc. (UFPI) Bundle
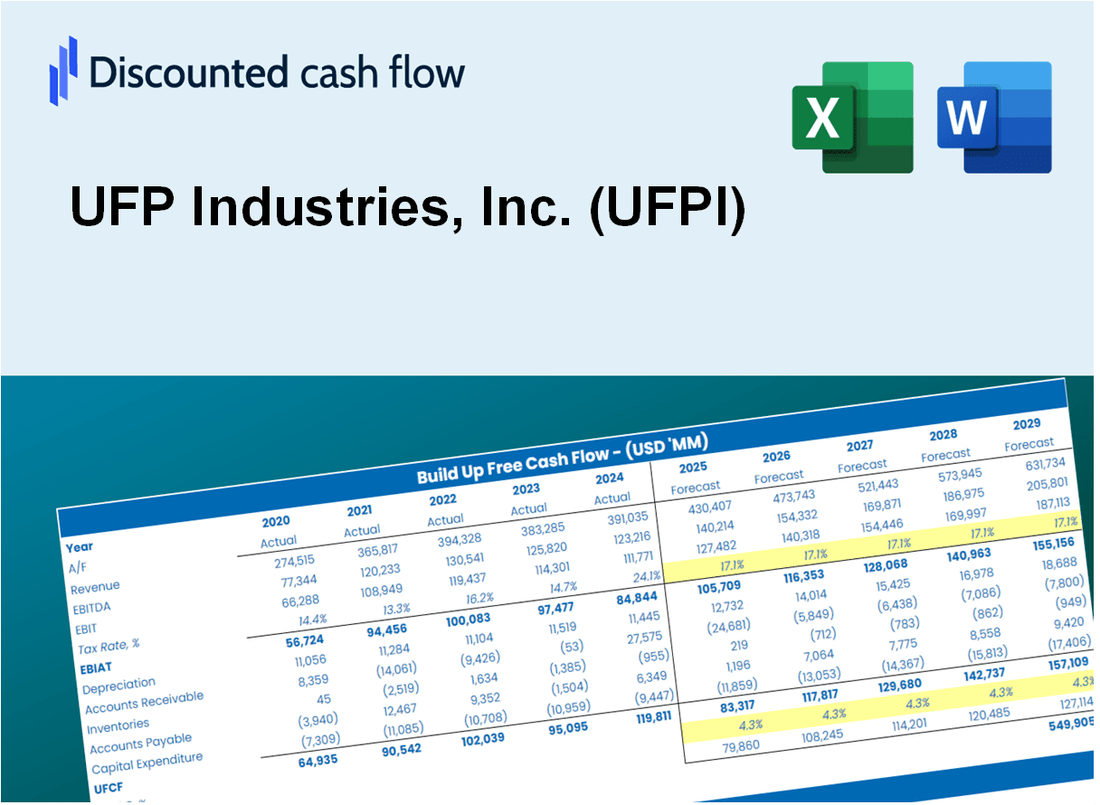
Entdecken Sie den wahren Wert von UFP Industries, Inc. (UFPI) mit unserem erweiterten DCF -Taschenrechner! Passen Sie wesentliche Annahmen an, erkunden Sie verschiedene Szenarien und beurteilen Sie, wie unterschiedliche Änderungen die Bewertung der UFP Industries, Inc. (UFPI) beeinflussen - alles innerhalb einer einzelnen Excel -Vorlage.
What You Will Get
- Real UFPI Financial Data: Pre-filled with UFP Industries’ historical and projected data for precise analysis.
- Fully Editable Template: Modify key inputs like revenue growth, WACC, and EBITDA % with ease.
- Automatic Calculations: See UFP Industries’ intrinsic value update instantly based on your changes.
- Professional Valuation Tool: Designed for investors, analysts, and consultants seeking accurate DCF results.
- User-Friendly Design: Simple structure and clear instructions for all experience levels.
Key Features
- Accurate UFP Financials: Gain access to reliable pre-loaded historical data and future forecasts.
- Customizable Forecast Inputs: Modify highlighted cells for key metrics like WACC, growth rates, and profit margins.
- Real-Time Calculations: Automatic updates for DCF, Net Present Value (NPV), and cash flow assessments.
- User-Friendly Dashboard: Clear charts and summaries to easily visualize your valuation outcomes.
- Designed for All Skill Levels: An intuitive layout suitable for investors, CFOs, and consultants alike.
How It Works
- Download the Template: Gain immediate access to the Excel-based UFPI DCF Calculator.
- Input Your Assumptions: Modify the yellow-highlighted cells for growth rates, WACC, margins, and additional factors.
- Instant Calculations: The model automatically recalculates UFP Industries' intrinsic value.
- Test Scenarios: Experiment with various assumptions to assess potential changes in valuation.
- Analyze and Decide: Utilize the results to inform your investment or financial analysis.
Why Choose This Calculator for UFP Industries, Inc. (UFPI)?
- Designed for Experts: A sophisticated tool tailored for analysts, CFOs, and industry consultants.
- Accurate Financial Data: UFP Industries' historical and projected financials are preloaded for precise analysis.
- Flexible Scenario Analysis: Effortlessly test various forecasts and assumptions.
- Comprehensive Outputs: Automatically computes intrinsic value, NPV, and essential financial metrics.
- User-Friendly Interface: Step-by-step guidance simplifies the calculation process.
Who Should Use This Product?
- Professional Investors: Develop comprehensive and accurate valuation models for analyzing UFP Industries, Inc. (UFPI) investments.
- Corporate Finance Teams: Evaluate valuation scenarios to inform strategic decisions within their organizations.
- Consultants and Advisors: Deliver precise valuation insights for clients interested in UFP Industries, Inc. (UFPI) stock.
- Students and Educators: Utilize real-world data to enhance learning and practice in financial modeling.
- Industry Analysts: Gain insights into the valuation methods applicable to companies like UFP Industries, Inc. (UFPI).
What the Template Contains
- Comprehensive DCF Model: Editable template featuring detailed valuation calculations.
- Real-World Data: UFP Industries, Inc. (UFPI)’s historical and projected financials preloaded for analysis.
- Customizable Parameters: Adjust WACC, growth rates, and tax assumptions to explore various scenarios.
- Financial Statements: Complete annual and quarterly breakdowns for in-depth insights.
- Key Ratios: Integrated analysis for profitability, efficiency, and leverage metrics.
- Dashboard with Visual Outputs: Charts and tables designed for clear, actionable results.
Disclaimer
All information, articles, and product details provided on this website are for general informational and educational purposes only. We do not claim any ownership over, nor do we intend to infringe upon, any trademarks, copyrights, logos, brand names, or other intellectual property mentioned or depicted on this site. Such intellectual property remains the property of its respective owners, and any references here are made solely for identification or informational purposes, without implying any affiliation, endorsement, or partnership.
We make no representations or warranties, express or implied, regarding the accuracy, completeness, or suitability of any content or products presented. Nothing on this website should be construed as legal, tax, investment, financial, medical, or other professional advice. In addition, no part of this site—including articles or product references—constitutes a solicitation, recommendation, endorsement, advertisement, or offer to buy or sell any securities, franchises, or other financial instruments, particularly in jurisdictions where such activity would be unlawful.
All content is of a general nature and may not address the specific circumstances of any individual or entity. It is not a substitute for professional advice or services. Any actions you take based on the information provided here are strictly at your own risk. You accept full responsibility for any decisions or outcomes arising from your use of this website and agree to release us from any liability in connection with your use of, or reliance upon, the content or products found herein.