
|
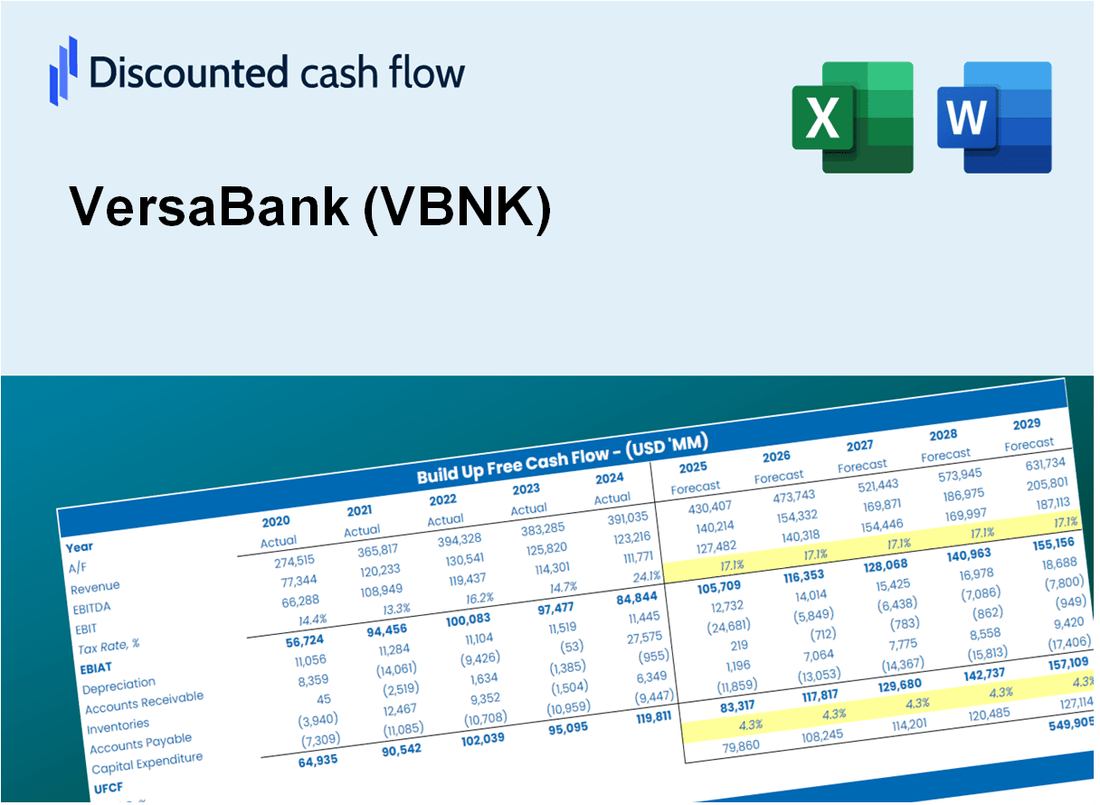
Versabank (VBNK) DCF -Bewertung |
Fully Editable: Tailor To Your Needs In Excel Or Sheets
Professional Design: Trusted, Industry-Standard Templates
Investor-Approved Valuation Models
MAC/PC Compatible, Fully Unlocked
No Expertise Is Needed; Easy To Follow
VersaBank (VBNK) Bundle
Bewerten Sie die finanziellen Aussichten von Versabank wie ein Experte! Dieser (VBNK) DCF-Taschenrechner bietet Ihnen vorgefüllte Finanzdaten und die vollständige Flexibilität, um das Umsatzwachstum, die WACC, die Margen und die anderen entscheidenden Annahmen zu ändern, um sich an Ihren Vorhersagen auszurichten.
What You Will Receive
- Pre-Filled Financial Model: Utilize VersaBank’s actual data for accurate DCF valuation.
- Complete Forecast Control: Modify revenue growth, margins, WACC, and other essential drivers.
- Instant Calculations: Automatic updates provide immediate results as you make adjustments.
- Investor-Ready Template: A polished Excel file crafted for professional-level valuation.
- Customizable and Reusable: Designed for adaptability, enabling repeated use for comprehensive forecasts.
Key Features
- Comprehensive VersaBank Financials: Gain access to reliable pre-loaded historical data and future forecasts for VBNK.
- Adjustable Forecast Parameters: Modify highlighted cells for key metrics like WACC, growth rates, and profit margins.
- Real-Time Calculations: Automatic updates to DCF, Net Present Value (NPV), and cash flow metrics.
- User-Friendly Dashboard: Intuitive charts and summaries to effectively visualize your valuation insights.
- Designed for All Levels: A straightforward, easy-to-navigate structure tailored for investors, CFOs, and consultants alike.
How It Works
- Download: Get the pre-configured Excel file containing VersaBank’s (VBNK) financial data.
- Customize: Modify projections, including loan growth, net interest margin, and capital ratios.
- Update Automatically: The intrinsic value and NPV calculations refresh in real-time.
- Test Scenarios: Develop various forecasts and analyze results immediately.
- Make Decisions: Leverage the valuation insights to inform your investment choices.
Why Choose This Calculator for VersaBank (VBNK)?
- Accuracy: Leverages real VersaBank financials for precise data.
- Flexibility: Built to allow users to easily test and adjust inputs.
- Time-Saving: Eliminate the need to create a DCF model from the ground up.
- Professional-Grade: Crafted with the precision and usability expected by CFOs.
- User-Friendly: Intuitive design makes it accessible for users without extensive financial modeling skills.
Who Should Use This Product?
- Investors: Evaluate VersaBank’s (VBNK) performance before making investment decisions.
- CFOs and Financial Analysts: Optimize valuation methodologies and analyze financial projections.
- Startup Founders: Understand the valuation processes of established financial institutions like VersaBank.
- Consultants: Create comprehensive valuation reports tailored for clients in the banking sector.
- Students and Educators: Utilize current data to teach and apply valuation strategies in finance courses.
What the Template Contains
- Pre-Filled DCF Model: VersaBank’s financial data preloaded for immediate use.
- WACC Calculator: Detailed calculations for Weighted Average Cost of Capital.
- Financial Ratios: Evaluate VersaBank’s profitability, leverage, and efficiency.
- Editable Inputs: Change assumptions such as growth, margins, and CAPEX to fit your scenarios.
- Financial Statements: Annual and quarterly reports to support detailed analysis.
- Interactive Dashboard: Easily visualize key valuation metrics and results.
Disclaimer
All information, articles, and product details provided on this website are for general informational and educational purposes only. We do not claim any ownership over, nor do we intend to infringe upon, any trademarks, copyrights, logos, brand names, or other intellectual property mentioned or depicted on this site. Such intellectual property remains the property of its respective owners, and any references here are made solely for identification or informational purposes, without implying any affiliation, endorsement, or partnership.
We make no representations or warranties, express or implied, regarding the accuracy, completeness, or suitability of any content or products presented. Nothing on this website should be construed as legal, tax, investment, financial, medical, or other professional advice. In addition, no part of this site—including articles or product references—constitutes a solicitation, recommendation, endorsement, advertisement, or offer to buy or sell any securities, franchises, or other financial instruments, particularly in jurisdictions where such activity would be unlawful.
All content is of a general nature and may not address the specific circumstances of any individual or entity. It is not a substitute for professional advice or services. Any actions you take based on the information provided here are strictly at your own risk. You accept full responsibility for any decisions or outcomes arising from your use of this website and agree to release us from any liability in connection with your use of, or reliance upon, the content or products found herein.