
|
VGP NV (VGP.BR) DCF -Bewertung |
Fully Editable: Tailor To Your Needs In Excel Or Sheets
Professional Design: Trusted, Industry-Standard Templates
Investor-Approved Valuation Models
MAC/PC Compatible, Fully Unlocked
No Expertise Is Needed; Easy To Follow
VGP NV (VGP.BR) Bundle
Übernehmen Sie die Ladung Ihrer VGP NV (VGPBR) -Wundierungsanalyse mit unserem ausgefeilten DCF -Taschenrechner! Mit dieser Excel -Vorlage können Sie mit tatsächlichen VGPBR -Daten ausgestattet werden, um Prognosen und Annahmen anzupassen, um den inneren Wert von VGP NV mit Genauigkeit zu bestimmen.
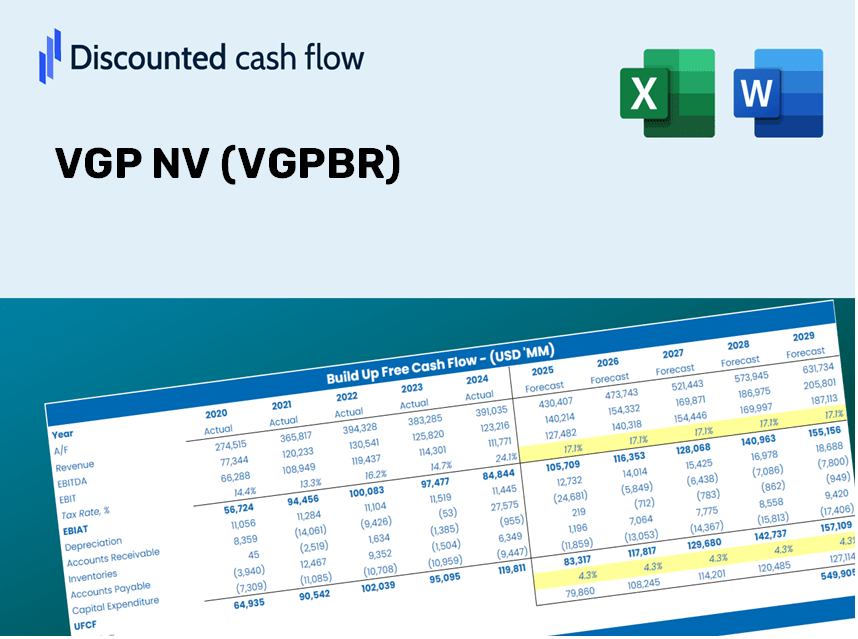
Discounted Cash Flow (DCF) - (USD MM)
| Year | AY1 2020 |
AY2 2021 |
AY3 2022 |
AY4 2023 |
AY5 2024 |
FY1 2025 |
FY2 2026 |
FY3 2027 |
FY4 2028 |
FY5 2029 |
|---|---|---|---|---|---|---|---|---|---|---|
| Revenue | 31.5 | 46.4 | 88.3 | 120.2 | 125.5 | 181.5 | 262.4 | 379.4 | 548.5 | 793.0 |
| Revenue Growth, % | 0 | 47.5 | 90.26 | 36.14 | 4.43 | 44.58 | 44.58 | 44.58 | 44.58 | 44.58 |
| EBITDA | -8.2 | -17.9 | 32.1 | 97.9 | 371.0 | 55.5 | 80.3 | 116.1 | 167.8 | 242.6 |
| EBITDA, % | -26.15 | -38.67 | 36.32 | 81.46 | 295.55 | 30.59 | 30.59 | 30.59 | 30.59 | 30.59 |
| Depreciation | 2.1 | 2.4 | 4.5 | 5.9 | 8.6 | 10.4 | 15.1 | 21.8 | 31.5 | 45.5 |
| Depreciation, % | 6.6 | 5.24 | 5.07 | 4.93 | 6.86 | 5.74 | 5.74 | 5.74 | 5.74 | 5.74 |
| EBIT | -10.3 | -20.4 | 27.6 | 92.0 | 362.4 | 47.6 | 68.8 | 99.5 | 143.8 | 208.0 |
| EBIT, % | -32.75 | -43.91 | 31.25 | 76.54 | 288.69 | 26.22 | 26.22 | 26.22 | 26.22 | 26.22 |
| Total Cash | 222.4 | 222.2 | 699.2 | 209.9 | 492.5 | 181.5 | 262.4 | 379.4 | 548.5 | 793.0 |
| Total Cash, percent | .0 | .0 | .0 | .0 | .0 | .0 | .0 | .0 | .0 | .0 |
| Account Receivables | 7.8 | 83.6 | 16.1 | 15.9 | 29.6 | 65.3 | 94.3 | 136.4 | 197.2 | 285.2 |
| Account Receivables, % | 24.73 | 180.16 | 18.19 | 13.25 | 23.61 | 35.96 | 35.96 | 35.96 | 35.96 | 35.96 |
| Inventories | .0 | .0 | .0 | .0 | .0 | .0 | .0 | .0 | .0 | .0 |
| Inventories, % | 0 | 0 | 0 | 0 | 0 | 0 | 0 | 0 | 0 | 0 |
| Accounts Payable | 58.1 | 95.2 | 98.1 | 67.0 | 69.9 | 149.4 | 215.9 | 312.2 | 451.4 | 652.6 |
| Accounts Payable, % | 184.67 | 205.12 | 111.09 | 55.76 | 55.71 | 82.29 | 82.29 | 82.29 | 82.29 | 82.29 |
| Capital Expenditure | 134.5 | 720.4 | 240.2 | .0 | .0 | .0 | .0 | .0 | .0 | .0 |
| Capital Expenditure, % | 427.6 | 1552.47 | 272.02 | 0 | 0 | 0 | 0 | 0 | 0 | 0 |
| Tax Rate, % | 10.19 | 10.19 | 10.19 | 10.19 | 10.19 | 10.19 | 10.19 | 10.19 | 10.19 | 10.19 |
| EBITAT | -9.3 | -17.3 | 23.7 | 71.2 | 325.5 | 40.8 | 59.0 | 85.3 | 123.3 | 178.3 |
| Depreciation | ||||||||||
| Changes in Account Receivables | ||||||||||
| Changes in Inventories | ||||||||||
| Changes in Accounts Payable | ||||||||||
| Capital Expenditure | ||||||||||
| UFCF | 177.6 | 666.8 | 338.8 | 46.2 | 323.3 | 95.0 | 111.5 | 161.3 | 233.1 | 337.1 |
| WACC, % | 7.24 | 7.16 | 7.17 | 7.04 | 7.23 | 7.17 | 7.17 | 7.17 | 7.17 | 7.17 |
| PV UFCF | ||||||||||
| SUM PV UFCF | 732.0 | |||||||||
| Long Term Growth Rate, % | 2.00 | |||||||||
| Free cash flow (T + 1) | 344 | |||||||||
| Terminal Value | 6,651 | |||||||||
| Present Terminal Value | 4,705 | |||||||||
| Enterprise Value | 5,437 | |||||||||
| Net Debt | 1,565 | |||||||||
| Equity Value | 3,872 | |||||||||
| Diluted Shares Outstanding, MM | 27 | |||||||||
| Equity Value Per Share | 141.88 |
Benefits You Will Receive
- Pre-Filled Financial Model: VGP NV’s actual data allows for accurate DCF valuation.
- Comprehensive Forecast Control: Modify revenue growth rates, profit margins, WACC, and other essential metrics.
- Real-Time Calculations: Instantaneous updates guarantee you see changes reflected immediately.
- Investor-Ready Template: A polished Excel file crafted for high-quality valuation presentations.
- Customizable and Reusable: Designed for adaptability, enabling repeated use for in-depth forecasts.
Key Features
- Accurate VGP NV Financials: Gain access to reliable pre-loaded historical data and future forecasts for VGP NV (VGPBR).
- Customizable Financial Projections: Modify highlighted fields such as WACC, growth rates, and profit margins to tailor your analysis.
- Real-Time Calculations: Enjoy automatic updates for DCF, Net Present Value (NPV), and cash flow assessments.
- Interactive Visual Dashboard: Utilize easy-to-understand charts and summaries to represent your valuation findings effectively.
- Designed for All Experience Levels: An intuitive layout suitable for investors, CFOs, and consultants, whether seasoned or new.
How It Works
- Step 1: Download the Excel file.
- Step 2: Review VGP NV's pre-filled financial data and projections.
- Step 3: Adjust key inputs such as revenue growth, WACC, and tax rates (highlighted cells).
- Step 4: Observe the DCF model update in real-time as you modify your assumptions.
- Step 5: Evaluate the outputs and leverage the results for your investment choices.
Why Opt for This Calculator?
- All-in-One Tool: Combines DCF, WACC, and financial ratio analyses for a comprehensive evaluation.
- Flexible Inputs: Modify the yellow-highlighted cells to explore different scenarios.
- In-Depth Analysis: Automatically computes VGP NV’s intrinsic value and Net Present Value.
- Preloaded Information: Access to historical and projected data for precise starting metrics.
- High-Quality Standards: Perfect for financial analysts, investors, and business advisors.
Who Can Benefit from VGP NV (VGPBR)?
- Investors: Make informed choices with a top-tier valuation tool tailored for VGP NV (VGPBR).
- Financial Analysts: Streamline your workflow with an easily customizable DCF model designed for VGP NV (VGPBR).
- Consultants: Efficiently modify the template for client presentations or detailed reports on VGP NV (VGPBR).
- Finance Enthusiasts: Enhance your knowledge of valuation methods through practical examples related to VGP NV (VGPBR).
- Educators and Students: Utilize it as a hands-on resource in finance courses focusing on VGP NV (VGPBR).
Contents of the Template
- Pre-Filled Data: Contains VGP NV’s historical financial performance and projections.
- Discounted Cash Flow Model: An editable DCF valuation model with automated computations.
- Weighted Average Cost of Capital (WACC): A specialized sheet for calculating WACC using your custom inputs.
- Key Financial Ratios: Evaluate VGP NV’s profitability, efficiency, and financial leverage.
- Customizable Inputs: Easily modify revenue growth rates, margins, and tax percentages.
- Clear Dashboard: Visual representations and tables that summarize essential valuation outcomes.
Disclaimer
All information, articles, and product details provided on this website are for general informational and educational purposes only. We do not claim any ownership over, nor do we intend to infringe upon, any trademarks, copyrights, logos, brand names, or other intellectual property mentioned or depicted on this site. Such intellectual property remains the property of its respective owners, and any references here are made solely for identification or informational purposes, without implying any affiliation, endorsement, or partnership.
We make no representations or warranties, express or implied, regarding the accuracy, completeness, or suitability of any content or products presented. Nothing on this website should be construed as legal, tax, investment, financial, medical, or other professional advice. In addition, no part of this site—including articles or product references—constitutes a solicitation, recommendation, endorsement, advertisement, or offer to buy or sell any securities, franchises, or other financial instruments, particularly in jurisdictions where such activity would be unlawful.
All content is of a general nature and may not address the specific circumstances of any individual or entity. It is not a substitute for professional advice or services. Any actions you take based on the information provided here are strictly at your own risk. You accept full responsibility for any decisions or outcomes arising from your use of this website and agree to release us from any liability in connection with your use of, or reliance upon, the content or products found herein.