
|
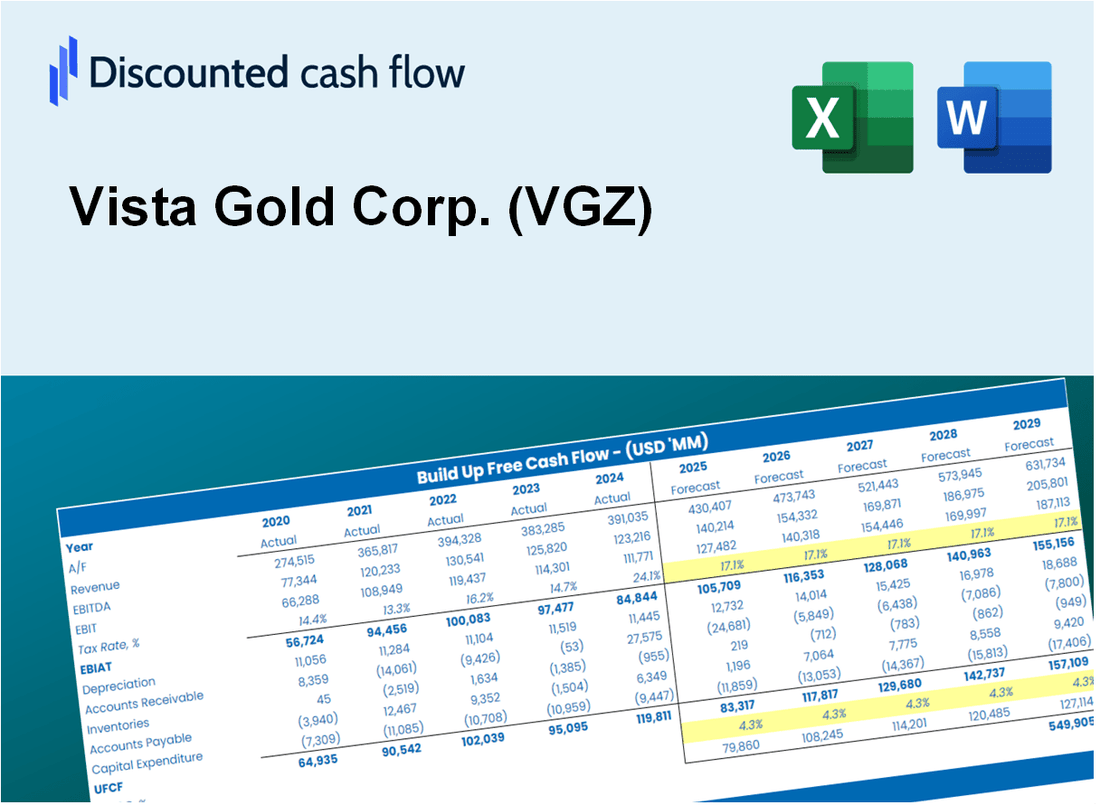
Vista Gold Corp. (VGZ) DCF -Bewertung |
Fully Editable: Tailor To Your Needs In Excel Or Sheets
Professional Design: Trusted, Industry-Standard Templates
Investor-Approved Valuation Models
MAC/PC Compatible, Fully Unlocked
No Expertise Is Needed; Easy To Follow
Vista Gold Corp. (VGZ) Bundle
Optimieren Sie Ihre Zeit und verbessern Sie die Präzision mit unserem (VGZ) DCF -Taschenrechner! In diesem Tool wird dieses Tool mit genauen Vista Gold Corp. -Daten und anpassbaren Annahmen ermöglicht, wie ein erfahrener Investor die Prognose, Analyse und Wertschöpfung Vista Gold Corp.
What You Will Receive
- Comprehensive Financial Model: Vista Gold Corp.’s (VGZ) actual data facilitates accurate DCF valuation.
- Complete Forecast Control: Modify revenue growth, profit margins, WACC, and other essential parameters.
- Real-Time Calculations: Automatic updates allow you to view results instantly as adjustments are made.
- Professional-Grade Template: A polished Excel file crafted for high-quality valuation presentations.
- Flexible and Reusable: Designed for adaptability, enabling ongoing use for in-depth forecasts.
Key Features
- Customizable Exploration Parameters: Adjust essential factors such as gold production estimates, operational costs, and project timelines.
- Instant DCF Valuation: Quickly computes intrinsic value, net present value (NPV), and other financial metrics.
- High Precision Analytics: Incorporates Vista Gold Corp.'s real-world data for accurate valuation results.
- Simplified Scenario Analysis: Easily evaluate various assumptions and analyze different outcomes.
- Efficiency Booster: Avoid the hassle of creating intricate valuation models from the ground up.
How It Works
- Step 1: Download the Excel file for Vista Gold Corp. (VGZ).
- Step 2: Review Vista Gold's pre-filled financial data and projections.
- Step 3: Adjust key inputs such as revenue growth, WACC, and tax rates (highlighted cells).
- Step 4: Observe the DCF model update in real-time as you modify your assumptions.
- Step 5: Evaluate the outputs and leverage the results for your investment strategies.
Why Choose This Calculator for Vista Gold Corp. (VGZ)?
- Designed for Experts: A sophisticated tool utilized by geologists, investment analysts, and mining consultants.
- Accurate Data: Vista Gold’s historical and projected financials are preloaded for precise analysis.
- Flexible Scenario Analysis: Effortlessly simulate various forecasts and assumptions.
- Comprehensive Outputs: Automatically computes intrinsic value, NPV, and essential financial metrics.
- User-Friendly: Step-by-step guidance ensures a smooth experience throughout the process.
Who Should Use This Product?
- Individual Investors: Gain insights to make informed decisions about buying or selling Vista Gold Corp. (VGZ) stock.
- Financial Analysts: Enhance valuation processes with ready-to-use financial models tailored for Vista Gold Corp. (VGZ).
- Consultants: Provide clients with professional valuation insights for Vista Gold Corp. (VGZ) quickly and accurately.
- Business Owners: Learn how mining companies like Vista Gold Corp. (VGZ) are valued to inform your own business strategies.
- Finance Students: Study valuation techniques using real-world data and scenarios related to Vista Gold Corp. (VGZ).
What the Template Contains
- Historical Data: Includes Vista Gold Corp.'s (VGZ) past financials and baseline forecasts.
- DCF and Levered DCF Models: Detailed templates to calculate Vista Gold Corp.'s (VGZ) intrinsic value.
- WACC Sheet: Pre-built calculations for Weighted Average Cost of Capital.
- Editable Inputs: Modify key drivers like growth rates, EBITDA %, and CAPEX assumptions.
- Quarterly and Annual Statements: A complete breakdown of Vista Gold Corp.'s (VGZ) financials.
- Interactive Dashboard: Visualize valuation results and projections dynamically.
Disclaimer
All information, articles, and product details provided on this website are for general informational and educational purposes only. We do not claim any ownership over, nor do we intend to infringe upon, any trademarks, copyrights, logos, brand names, or other intellectual property mentioned or depicted on this site. Such intellectual property remains the property of its respective owners, and any references here are made solely for identification or informational purposes, without implying any affiliation, endorsement, or partnership.
We make no representations or warranties, express or implied, regarding the accuracy, completeness, or suitability of any content or products presented. Nothing on this website should be construed as legal, tax, investment, financial, medical, or other professional advice. In addition, no part of this site—including articles or product references—constitutes a solicitation, recommendation, endorsement, advertisement, or offer to buy or sell any securities, franchises, or other financial instruments, particularly in jurisdictions where such activity would be unlawful.
All content is of a general nature and may not address the specific circumstances of any individual or entity. It is not a substitute for professional advice or services. Any actions you take based on the information provided here are strictly at your own risk. You accept full responsibility for any decisions or outcomes arising from your use of this website and agree to release us from any liability in connection with your use of, or reliance upon, the content or products found herein.