
|
Verra Mobility Corporation (VRRM) DCF -Bewertung |
Fully Editable: Tailor To Your Needs In Excel Or Sheets
Professional Design: Trusted, Industry-Standard Templates
Investor-Approved Valuation Models
MAC/PC Compatible, Fully Unlocked
No Expertise Is Needed; Easy To Follow
Verra Mobility Corporation (VRRM) Bundle
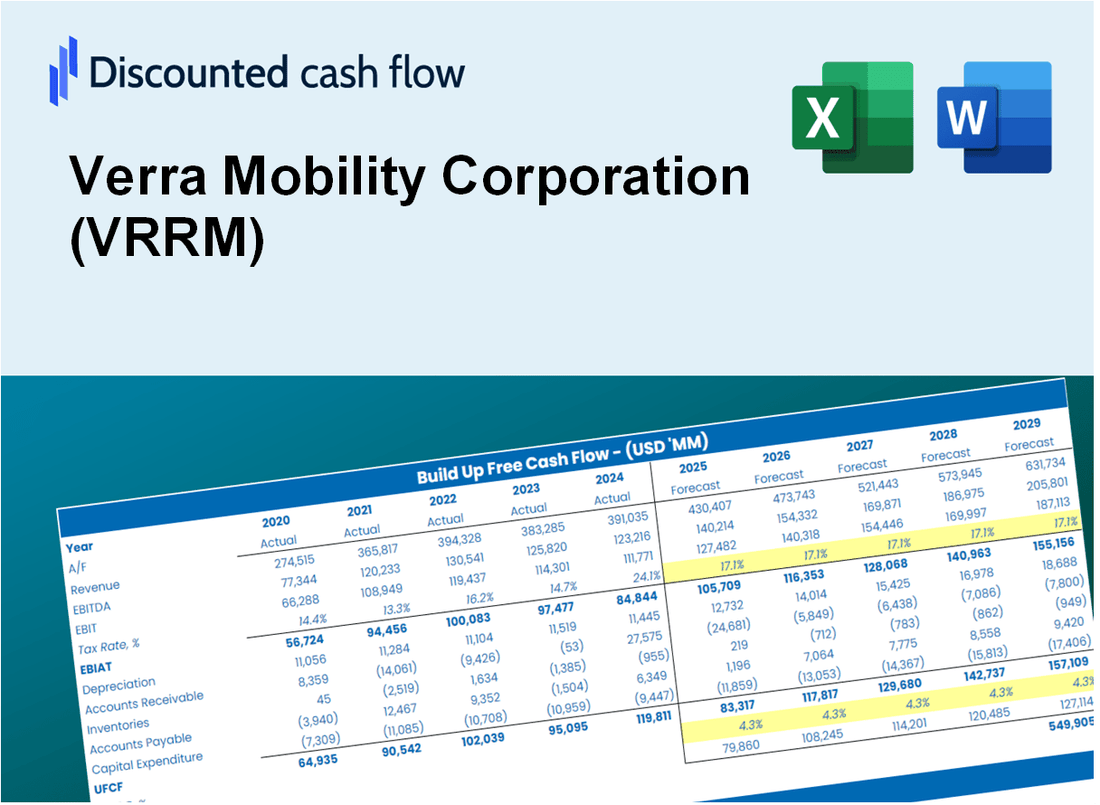
Optimieren Sie Ihre Zeit und steigern Sie die Präzision mit unserem (VRRM) DCF -Taschenrechner! Mit realen Daten der Verra Mobility Corporation und anpassbaren Annahmen befindet sich dieses Tool in der Lage, die Mobilität von Verra wie ein erfahrener Investor zu prognostizieren, zu analysieren und zu schätzen.
What You Will Receive
- Comprehensive Financial Model: Verra Mobility Corporation’s (VRRM) actual data facilitates accurate DCF valuation.
- Complete Forecast Flexibility: Modify revenue growth, profit margins, WACC, and other essential factors.
- Real-Time Calculations: Automatic updates provide immediate insights as you adjust parameters.
- Professional-Grade Template: An expertly crafted Excel file tailored for high-quality valuation.
- Adaptable and Reusable: Designed for versatility, enabling ongoing use for in-depth forecasts.
Key Features
- Customizable Financial Inputs: Adjust essential variables such as revenue growth, EBITDA margin, and capital investments.
- Instant DCF Valuation: Automatically computes intrinsic value, NPV, and other financial metrics in real-time.
- High-Precision Accuracy: Leverages Verra Mobility's actual financial data for dependable valuation results.
- Simplified Scenario Analysis: Effortlessly evaluate various assumptions and analyze the resulting impacts.
- Efficiency Booster: Save time by avoiding the need to create intricate valuation models from the ground up.
How It Works
- Download the Template: Gain immediate access to the Excel-based VRRM DCF Calculator.
- Input Your Assumptions: Modify the yellow-highlighted cells for growth rates, WACC, margins, and other variables.
- Instant Calculations: The model automatically recalculates Verra Mobility's intrinsic value.
- Test Scenarios: Experiment with various assumptions to assess potential changes in valuation.
- Analyze and Decide: Utilize the results to inform your investment or financial decisions.
Why Choose This Calculator for Verra Mobility Corporation (VRRM)?
- Designed for Experts: A sophisticated tool utilized by financial analysts, CFOs, and industry consultants.
- Accurate Data: Verra Mobility's historical and projected financials are preloaded to ensure precision.
- Flexible Scenario Analysis: Easily test various forecasts and assumptions to see potential outcomes.
- Comprehensive Outputs: Automatically computes intrinsic value, NPV, and essential financial metrics.
- User-Friendly: Step-by-step guidance makes the process straightforward and accessible.
Who Should Use This Product?
- Finance Students: Explore valuation methodologies and practice with actual market data related to Verra Mobility Corporation (VRRM).
- Academics: Integrate advanced financial models into your teaching or research focused on transportation and mobility.
- Investors: Evaluate your investment strategies and assess the valuation metrics for Verra Mobility Corporation (VRRM).
- Analysts: Enhance your analysis process with a tailored, ready-to-use DCF model specific to Verra Mobility Corporation (VRRM).
- Small Business Owners: Understand the analytical approaches used by investors to evaluate companies like Verra Mobility Corporation (VRRM).
What the Template Contains
- Pre-Filled Data: Includes Verra Mobility Corporation’s historical financials and forecasts.
- Discounted Cash Flow Model: Editable DCF valuation model with automatic calculations.
- Weighted Average Cost of Capital (WACC): A dedicated sheet for calculating WACC based on custom inputs.
- Key Financial Ratios: Analyze Verra Mobility Corporation’s profitability, efficiency, and leverage.
- Customizable Inputs: Edit revenue growth, margins, and tax rates with ease.
- Clear Dashboard: Charts and tables summarizing key valuation results.
Disclaimer
All information, articles, and product details provided on this website are for general informational and educational purposes only. We do not claim any ownership over, nor do we intend to infringe upon, any trademarks, copyrights, logos, brand names, or other intellectual property mentioned or depicted on this site. Such intellectual property remains the property of its respective owners, and any references here are made solely for identification or informational purposes, without implying any affiliation, endorsement, or partnership.
We make no representations or warranties, express or implied, regarding the accuracy, completeness, or suitability of any content or products presented. Nothing on this website should be construed as legal, tax, investment, financial, medical, or other professional advice. In addition, no part of this site—including articles or product references—constitutes a solicitation, recommendation, endorsement, advertisement, or offer to buy or sell any securities, franchises, or other financial instruments, particularly in jurisdictions where such activity would be unlawful.
All content is of a general nature and may not address the specific circumstances of any individual or entity. It is not a substitute for professional advice or services. Any actions you take based on the information provided here are strictly at your own risk. You accept full responsibility for any decisions or outcomes arising from your use of this website and agree to release us from any liability in connection with your use of, or reliance upon, the content or products found herein.