
|
Verisk Analytics, Inc. (VRSK) DCF -Bewertung |
Fully Editable: Tailor To Your Needs In Excel Or Sheets
Professional Design: Trusted, Industry-Standard Templates
Investor-Approved Valuation Models
MAC/PC Compatible, Fully Unlocked
No Expertise Is Needed; Easy To Follow
Verisk Analytics, Inc. (VRSK) Bundle
Vereinfachen Sie die Bewertung von Verisk Analytics, Inc. (VRSK) mit diesem anpassbaren DCF -Taschenrechner! Mit Real Verisk Analytics, Inc. (VRSK) Finanzdaten und einstellbaren Prognoseeingaben können Sie Szenarien testen und Verisk Analytics, Inc. (VRSK) in Minuten aufdecken.
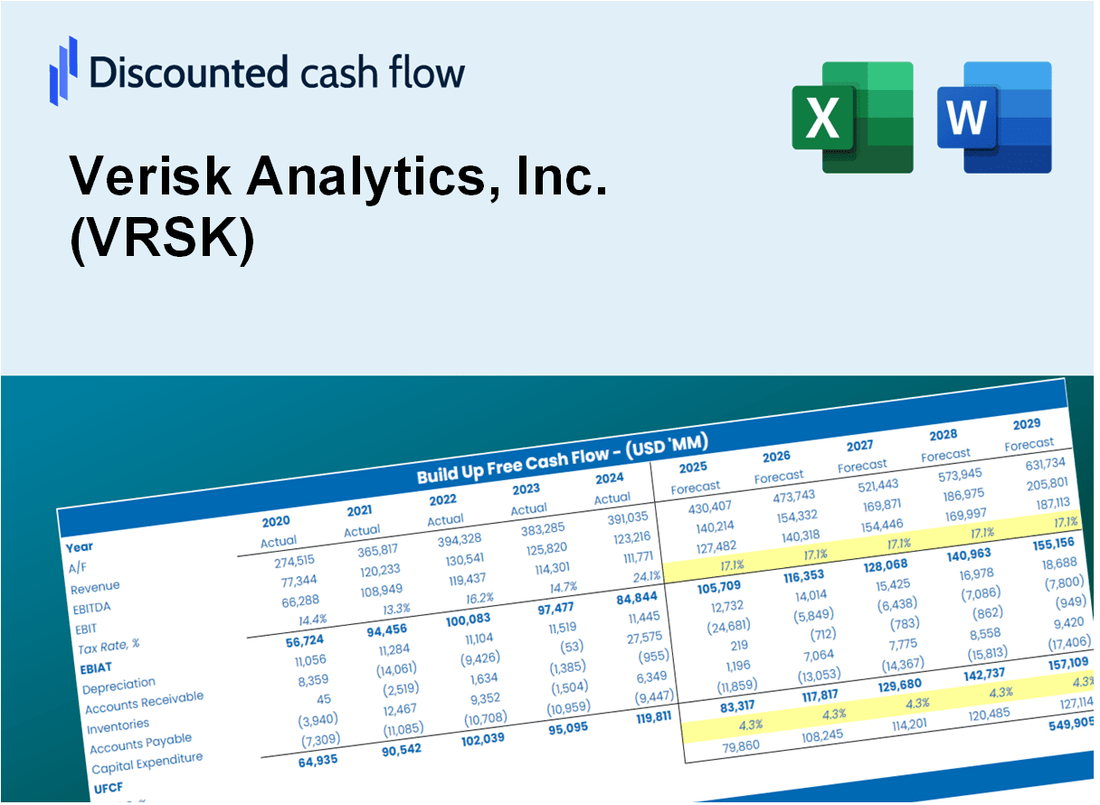
Discounted Cash Flow (DCF) - (USD MM)
| Year | AY1 2020 |
AY2 2021 |
AY3 2022 |
AY4 2023 |
AY5 2024 |
FY1 2025 |
FY2 2026 |
FY3 2027 |
FY4 2028 |
FY5 2029 |
|---|---|---|---|---|---|---|---|---|---|---|
| Revenue | 2,269.4 | 2,462.5 | 2,497.0 | 2,681.4 | 2,881.7 | 3,060.1 | 3,249.6 | 3,450.8 | 3,664.4 | 3,891.3 |
| Revenue Growth, % | 0 | 8.51 | 1.4 | 7.38 | 7.47 | 6.19 | 6.19 | 6.19 | 6.19 | 6.19 |
| EBITDA | 1,314.8 | 1,297.1 | 1,741.2 | 1,424.1 | 1,659.1 | 1,781.1 | 1,891.4 | 2,008.5 | 2,132.9 | 2,264.9 |
| EBITDA, % | 57.94 | 52.67 | 69.73 | 53.11 | 57.57 | 58.21 | 58.21 | 58.21 | 58.21 | 58.21 |
| Depreciation | 358.1 | 383.6 | 340.0 | 281.4 | 305.9 | 404.4 | 429.5 | 456.1 | 484.3 | 514.3 |
| Depreciation, % | 15.78 | 15.58 | 13.62 | 10.49 | 10.62 | 13.22 | 13.22 | 13.22 | 13.22 | 13.22 |
| EBIT | 956.7 | 913.5 | 1,401.2 | 1,142.7 | 1,353.2 | 1,376.7 | 1,461.9 | 1,552.4 | 1,648.6 | 1,750.6 |
| EBIT, % | 42.16 | 37.1 | 56.12 | 42.62 | 46.96 | 44.99 | 44.99 | 44.99 | 44.99 | 44.99 |
| Total Cash | 218.8 | 111.9 | 112.5 | 302.7 | 291.2 | 245.3 | 260.5 | 276.6 | 293.8 | 312.0 |
| Total Cash, percent | .0 | .0 | .0 | .0 | .0 | .0 | .0 | .0 | .0 | .0 |
| Account Receivables | 457.8 | 341.3 | 334.3 | 357.7 | 517.7 | 481.8 | 511.6 | 543.3 | 577.0 | 612.7 |
| Account Receivables, % | 20.17 | 13.86 | 13.39 | 13.34 | 17.97 | 15.75 | 15.75 | 15.75 | 15.75 | 15.75 |
| Inventories | .0 | .0 | .0 | .0 | .0 | .0 | .0 | .0 | .0 | .0 |
| Inventories, % | 0 | 0 | 0 | 0 | 0 | 0 | 0 | 0 | 0 | 0 |
| Accounts Payable | 99.3 | 92.2 | 128.7 | 158.4 | 85.5 | 135.6 | 143.9 | 152.9 | 162.3 | 172.4 |
| Accounts Payable, % | 4.38 | 3.74 | 5.15 | 5.91 | 2.97 | 4.43 | 4.43 | 4.43 | 4.43 | 4.43 |
| Capital Expenditure | -246.8 | -268.4 | -274.7 | -230.0 | -223.9 | -300.6 | -319.3 | -339.0 | -360.0 | -382.3 |
| Capital Expenditure, % | -10.88 | -10.9 | -11 | -8.58 | -7.77 | -9.82 | -9.82 | -9.82 | -9.82 | -9.82 |
| Tax Rate, % | 22.07 | 22.07 | 22.07 | 22.07 | 22.07 | 22.07 | 22.07 | 22.07 | 22.07 | 22.07 |
| EBITAT | 833.1 | 773.9 | 1,059.2 | 683.5 | 1,054.6 | 1,060.5 | 1,126.1 | 1,195.8 | 1,269.9 | 1,348.5 |
| Depreciation | ||||||||||
| Changes in Account Receivables | ||||||||||
| Changes in Inventories | ||||||||||
| Changes in Accounts Payable | ||||||||||
| Capital Expenditure | ||||||||||
| UFCF | 585.9 | 998.5 | 1,168.0 | 741.2 | 903.7 | 1,250.2 | 1,214.9 | 1,290.1 | 1,370.0 | 1,454.8 |
| WACC, % | 7.19 | 7.18 | 7.15 | 7.09 | 7.16 | 7.15 | 7.15 | 7.15 | 7.15 | 7.15 |
| PV UFCF | ||||||||||
| SUM PV UFCF | 5,342.3 | |||||||||
| Long Term Growth Rate, % | 4.00 | |||||||||
| Free cash flow (T + 1) | 1,513 | |||||||||
| Terminal Value | 47,965 | |||||||||
| Present Terminal Value | 33,953 | |||||||||
| Enterprise Value | 39,295 | |||||||||
| Net Debt | 2,955 | |||||||||
| Equity Value | 36,341 | |||||||||
| Diluted Shares Outstanding, MM | 143 | |||||||||
| Equity Value Per Share | 254.41 |
What You Will Receive
- Pre-Filled Financial Model: Verisk Analytics’ actual data enables accurate DCF valuation.
- Comprehensive Forecast Control: Modify revenue growth, margins, WACC, and other essential drivers.
- Real-Time Calculations: Automatic updates ensure you see results instantly as you make adjustments.
- Professional-Grade Template: A polished Excel file crafted for high-quality valuation.
- Flexible and Reusable: Designed for adaptability, allowing repeated use for in-depth forecasts.
Key Features
- Comprehensive Data Analytics Tools: Offers robust solutions for risk assessment and decision-making.
- Customizable Risk Models: Tailor risk assessment models to meet specific industry needs.
- Interactive Dashboards: User-friendly dashboards provide real-time insights into data trends.
- In-Depth Industry Reports: Access detailed reports and analytics on various sectors.
- API Integration: Seamlessly integrate with existing systems for enhanced data utilization.
How It Works
- Download: Obtain the ready-to-use Excel file containing Verisk Analytics' financial data.
- Customize: Modify forecasts, including revenue growth, EBITDA %, and WACC.
- Update Automatically: The intrinsic value and NPV calculations refresh in real-time.
- Test Scenarios: Generate multiple projections and instantly compare outcomes.
- Make Decisions: Utilize the valuation results to inform your investment strategy.
Why Choose This Calculator for Verisk Analytics, Inc. (VRSK)?
- Designed for Industry Experts: A sophisticated tool tailored for analysts, CFOs, and consultants in the analytics sector.
- Comprehensive Financial Data: Verisk’s historical and projected financials included for precise calculations.
- Flexible Scenario Analysis: Effortlessly test various forecasts and assumptions.
- Insightful Outputs: Automatically computes intrinsic value, NPV, and essential financial metrics.
- User-Friendly Interface: Step-by-step guidance simplifies the calculation process.
Who Should Use This Product?
- Data Analysts: Leverage advanced analytics to extract insights from Verisk Analytics' data.
- Risk Management Professionals: Assess and mitigate risks using comprehensive models provided by Verisk Analytics.
- Consultants and Advisors: Deliver informed recommendations to clients based on Verisk Analytics' market intelligence.
- Students and Educators: Explore real-time data to enhance learning in analytics and risk assessment.
- Industry Researchers: Utilize Verisk Analytics' resources to conduct thorough market research and analysis.
What the Template Contains
- Preloaded VRSK Data: Historical and projected financial data, including revenue, EBIT, and capital expenditures.
- DCF and WACC Models: Professional-grade sheets for calculating intrinsic value and Weighted Average Cost of Capital.
- Editable Inputs: Yellow-highlighted cells for adjusting revenue growth, tax rates, and discount rates.
- Financial Statements: Comprehensive annual and quarterly financials for deeper analysis.
- Key Ratios: Profitability, leverage, and efficiency ratios to evaluate performance.
- Dashboard and Charts: Visual summaries of valuation outcomes and assumptions.
Disclaimer
All information, articles, and product details provided on this website are for general informational and educational purposes only. We do not claim any ownership over, nor do we intend to infringe upon, any trademarks, copyrights, logos, brand names, or other intellectual property mentioned or depicted on this site. Such intellectual property remains the property of its respective owners, and any references here are made solely for identification or informational purposes, without implying any affiliation, endorsement, or partnership.
We make no representations or warranties, express or implied, regarding the accuracy, completeness, or suitability of any content or products presented. Nothing on this website should be construed as legal, tax, investment, financial, medical, or other professional advice. In addition, no part of this site—including articles or product references—constitutes a solicitation, recommendation, endorsement, advertisement, or offer to buy or sell any securities, franchises, or other financial instruments, particularly in jurisdictions where such activity would be unlawful.
All content is of a general nature and may not address the specific circumstances of any individual or entity. It is not a substitute for professional advice or services. Any actions you take based on the information provided here are strictly at your own risk. You accept full responsibility for any decisions or outcomes arising from your use of this website and agree to release us from any liability in connection with your use of, or reliance upon, the content or products found herein.