
|
Vasta Platform Limited (VSTA) DCF -Bewertung |
Fully Editable: Tailor To Your Needs In Excel Or Sheets
Professional Design: Trusted, Industry-Standard Templates
Investor-Approved Valuation Models
MAC/PC Compatible, Fully Unlocked
No Expertise Is Needed; Easy To Follow
Vasta Platform Limited (VSTA) Bundle
Verbessern Sie Ihre Anlagestrategien mit dem DCF -Taschenrechner von Vasta Platform Limited (VSTA)! Verwenden Sie reale Finanzdaten aus der Vasta -Plattform, passen Sie Wachstumsprojektionen und -kosten an und beobachten Sie sofort, wie sich diese Veränderungen auf den inneren Wert der Vasta -Plattform (VSTA) auswirken.
What You Will Receive
- Pre-Loaded Financial Model: Vasta Platform Limited’s actual data provides accurate DCF valuation.
- Comprehensive Forecast Control: Modify revenue growth, profit margins, WACC, and other essential factors.
- Real-Time Calculations: Automatic updates allow you to view results instantly as you make adjustments.
- Professional-Grade Template: A polished Excel file crafted for high-quality valuation.
- Flexible and Reusable: Designed for adaptability, enabling repeated use for in-depth forecasts.
Key Features
- Comprehensive Financial Data: Gain access to precise historical data and projections tailored for Vasta Platform Limited (VSTA).
- Tailored Forecast Assumptions: Modify highlighted cells for key metrics such as WACC, growth rates, and profit margins.
- Automated Calculations: Real-time updates for DCF, Net Present Value (NPV), and cash flow assessments.
- User-Friendly Dashboard: Intuitive charts and summaries to effectively present your valuation insights.
- Designed for All Skill Levels: A straightforward layout suitable for investors, CFOs, and consultants alike.
How It Works
- Download the Template: Gain immediate access to the Excel-based VSTA DCF Calculator.
- Input Your Assumptions: Modify the yellow-highlighted cells for growth rates, WACC, margins, and other variables.
- Instant Calculations: The model automatically recalculates Vasta Platform Limited’s intrinsic value.
- Test Scenarios: Experiment with various assumptions to assess potential changes in valuation.
- Analyze and Decide: Utilize the results to inform your investment or financial analysis.
Why Choose This Calculator for Vasta Platform Limited (VSTA)?
- Accuracy: Utilizes real Vasta financial data to ensure precise calculations.
- Flexibility: Built to allow users to easily test and adjust inputs as needed.
- Time-Saving: Eliminate the need to create a DCF model from the ground up.
- Professional-Grade: Crafted with the expertise and usability expected at the CFO level.
- User-Friendly: Intuitive design makes it accessible for users without extensive financial modeling skills.
Who Should Use This Product?
- Individual Investors: Make informed decisions about buying or selling Vasta Platform Limited (VSTA) stock.
- Financial Analysts: Streamline valuation processes with ready-to-use financial models for Vasta Platform Limited (VSTA).
- Consultants: Deliver professional valuation insights on Vasta Platform Limited (VSTA) to clients quickly and accurately.
- Business Owners: Understand how companies like Vasta Platform Limited (VSTA) are valued to guide your own strategy.
- Finance Students: Learn valuation techniques using real-world data and scenarios related to Vasta Platform Limited (VSTA).
What the Template Contains
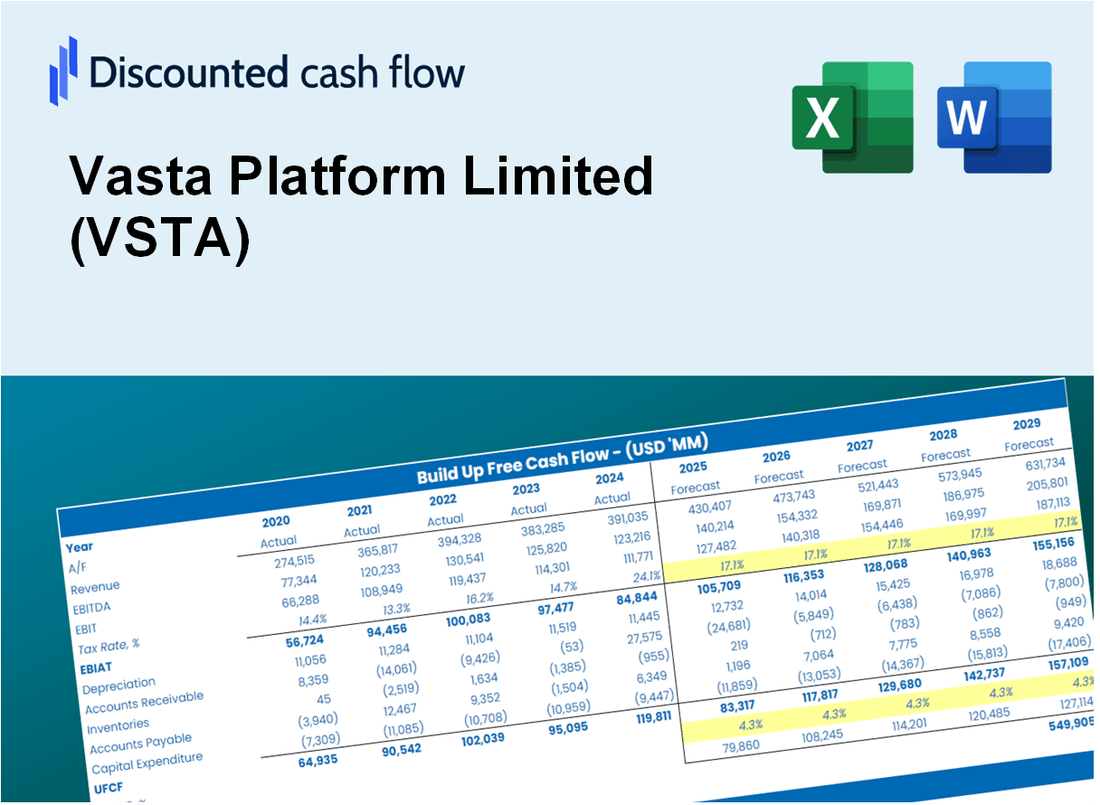
- Operating and Balance Sheet Data: Pre-filled Vasta Platform Limited (VSTA) historical data and forecasts, including revenue, EBITDA, EBIT, and capital expenditures.
- WACC Calculation: A dedicated sheet for Weighted Average Cost of Capital (WACC), including parameters like Beta, risk-free rate, and share price.
- DCF Valuation (Unlevered and Levered): Editable Discounted Cash Flow models showing intrinsic value with detailed calculations.
- Financial Statements: Pre-loaded financial statements (annual and quarterly) to support analysis.
- Key Ratios: Includes profitability, leverage, and efficiency ratios for Vasta Platform Limited (VSTA).
- Dashboard and Charts: Visual summary of valuation outputs and assumptions to analyze results easily.
Disclaimer
All information, articles, and product details provided on this website are for general informational and educational purposes only. We do not claim any ownership over, nor do we intend to infringe upon, any trademarks, copyrights, logos, brand names, or other intellectual property mentioned or depicted on this site. Such intellectual property remains the property of its respective owners, and any references here are made solely for identification or informational purposes, without implying any affiliation, endorsement, or partnership.
We make no representations or warranties, express or implied, regarding the accuracy, completeness, or suitability of any content or products presented. Nothing on this website should be construed as legal, tax, investment, financial, medical, or other professional advice. In addition, no part of this site—including articles or product references—constitutes a solicitation, recommendation, endorsement, advertisement, or offer to buy or sell any securities, franchises, or other financial instruments, particularly in jurisdictions where such activity would be unlawful.
All content is of a general nature and may not address the specific circumstances of any individual or entity. It is not a substitute for professional advice or services. Any actions you take based on the information provided here are strictly at your own risk. You accept full responsibility for any decisions or outcomes arising from your use of this website and agree to release us from any liability in connection with your use of, or reliance upon, the content or products found herein.