
|
Vistagen Therapeutics, Inc. (VTGN) DCF -Bewertung |
Fully Editable: Tailor To Your Needs In Excel Or Sheets
Professional Design: Trusted, Industry-Standard Templates
Investor-Approved Valuation Models
MAC/PC Compatible, Fully Unlocked
No Expertise Is Needed; Easy To Follow
VistaGen Therapeutics, Inc. (VTGN) Bundle
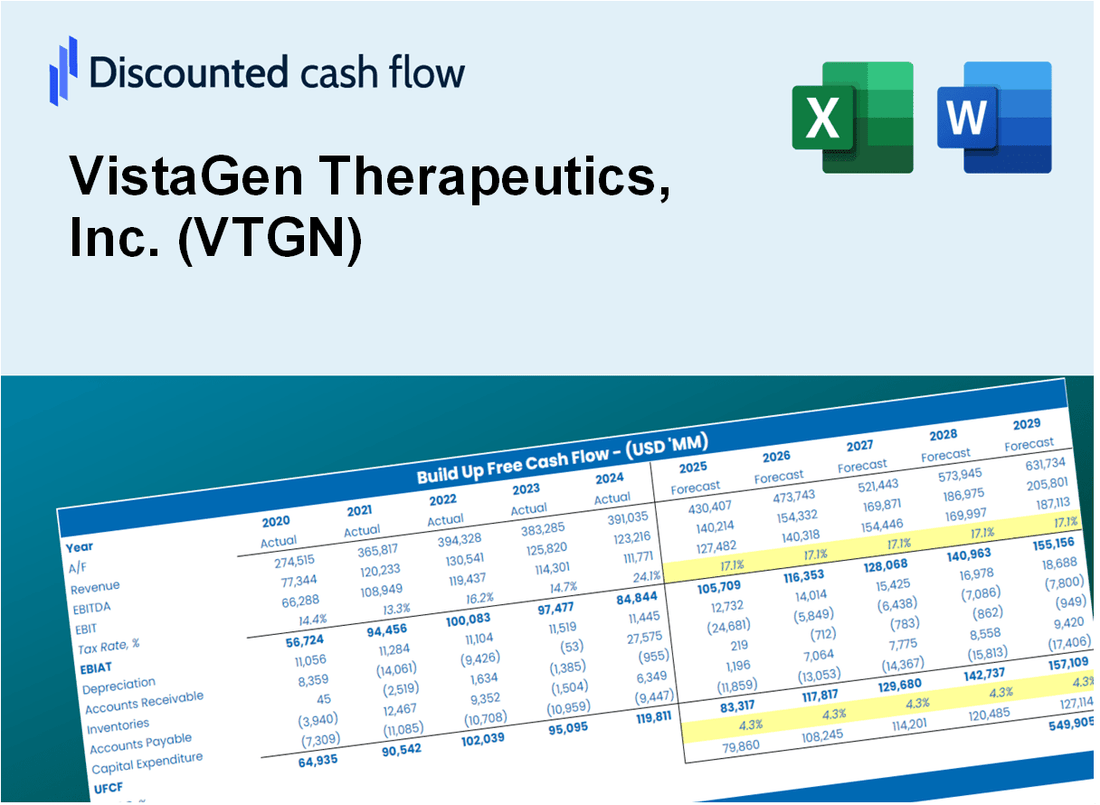
Entdecken Sie das wahre Potenzial von Vistagen Therapeutics, Inc. (VTGN) mit unserem fortschrittlichen DCF -Taschenrechner! Passen Sie die wichtigsten Annahmen an, erkunden Sie verschiedene Szenarien und bewerten Sie, wie Verschiebungen die Bewertung von Vistagen beeinflussen - alles innerhalb einer bequemen Excel -Vorlage.
What You Will Get
- Pre-Filled Financial Model: VistaGen’s actual data facilitates accurate DCF valuation.
- Full Forecast Control: Modify revenue growth, profit margins, WACC, and other critical factors.
- Instant Calculations: Automatic updates provide real-time results as you make adjustments.
- Investor-Ready Template: A polished Excel file crafted for professional-level valuation.
- Customizable and Reusable: Designed for adaptability, enabling repeated use for comprehensive forecasts.
Key Features
- Comprehensive VTGN Data: Pre-filled with VistaGen Therapeutics’ historical performance metrics and future projections.
- Customizable Input Parameters: Modify revenue growth rates, profit margins, discount rates, tax assumptions, and capital investments.
- Adaptive Valuation Framework: Real-time updates to Net Present Value (NPV) and intrinsic value based on your adjustments.
- Scenario Analysis: Develop various forecasting scenarios to evaluate different valuation possibilities.
- Intuitive Interface: Clean, organized, and tailored for both industry experts and newcomers.
How It Works
- Download the Template: Gain immediate access to the Excel-based VTGN DCF Calculator.
- Input Your Assumptions: Modify the yellow-highlighted cells for growth rates, WACC, margins, and other variables.
- Instant Calculations: The model automatically calculates VistaGen's intrinsic value.
- Test Scenarios: Experiment with different assumptions to assess potential changes in valuation.
- Analyze and Decide: Utilize the results to inform your investment or financial analysis.
Why Choose This Calculator for VistaGen Therapeutics, Inc. (VTGN)?
- User-Friendly Interface: Perfect for both novice and experienced users.
- Customizable Inputs: Adjust parameters easily to suit your analysis needs.
- Real-Time Feedback: Observe immediate updates to VistaGen’s valuation as you change inputs.
- Preloaded Data: Comes with VistaGen’s actual financial information for swift evaluations.
- Relied Upon by Experts: Favored by investors and analysts for making well-informed choices.
Who Should Use This Product?
- Investors: Accurately assess VistaGen Therapeutics, Inc.'s (VTGN) fair value before making investment decisions.
- CFOs: Utilize a professional-grade DCF model for financial reporting and analysis specific to biotech companies.
- Consultants: Quickly customize the template for valuation reports tailored to clients in the pharmaceutical sector.
- Entrepreneurs: Acquire insights into financial modeling practices utilized by leading biotech firms.
- Educators: Employ it as a teaching resource to illustrate valuation methodologies in the life sciences industry.
What the Template Contains
- Pre-Filled DCF Model: VistaGen Therapeutics’ (VTGN) financial data preloaded for immediate use.
- WACC Calculator: Detailed calculations for Weighted Average Cost of Capital.
- Financial Ratios: Evaluate VistaGen’s (VTGN) profitability, leverage, and efficiency.
- Editable Inputs: Change assumptions such as growth, margins, and CAPEX to fit your scenarios.
- Financial Statements: Annual and quarterly reports to support detailed analysis.
- Interactive Dashboard: Easily visualize key valuation metrics and results.
Disclaimer
All information, articles, and product details provided on this website are for general informational and educational purposes only. We do not claim any ownership over, nor do we intend to infringe upon, any trademarks, copyrights, logos, brand names, or other intellectual property mentioned or depicted on this site. Such intellectual property remains the property of its respective owners, and any references here are made solely for identification or informational purposes, without implying any affiliation, endorsement, or partnership.
We make no representations or warranties, express or implied, regarding the accuracy, completeness, or suitability of any content or products presented. Nothing on this website should be construed as legal, tax, investment, financial, medical, or other professional advice. In addition, no part of this site—including articles or product references—constitutes a solicitation, recommendation, endorsement, advertisement, or offer to buy or sell any securities, franchises, or other financial instruments, particularly in jurisdictions where such activity would be unlawful.
All content is of a general nature and may not address the specific circumstances of any individual or entity. It is not a substitute for professional advice or services. Any actions you take based on the information provided here are strictly at your own risk. You accept full responsibility for any decisions or outcomes arising from your use of this website and agree to release us from any liability in connection with your use of, or reliance upon, the content or products found herein.