
|
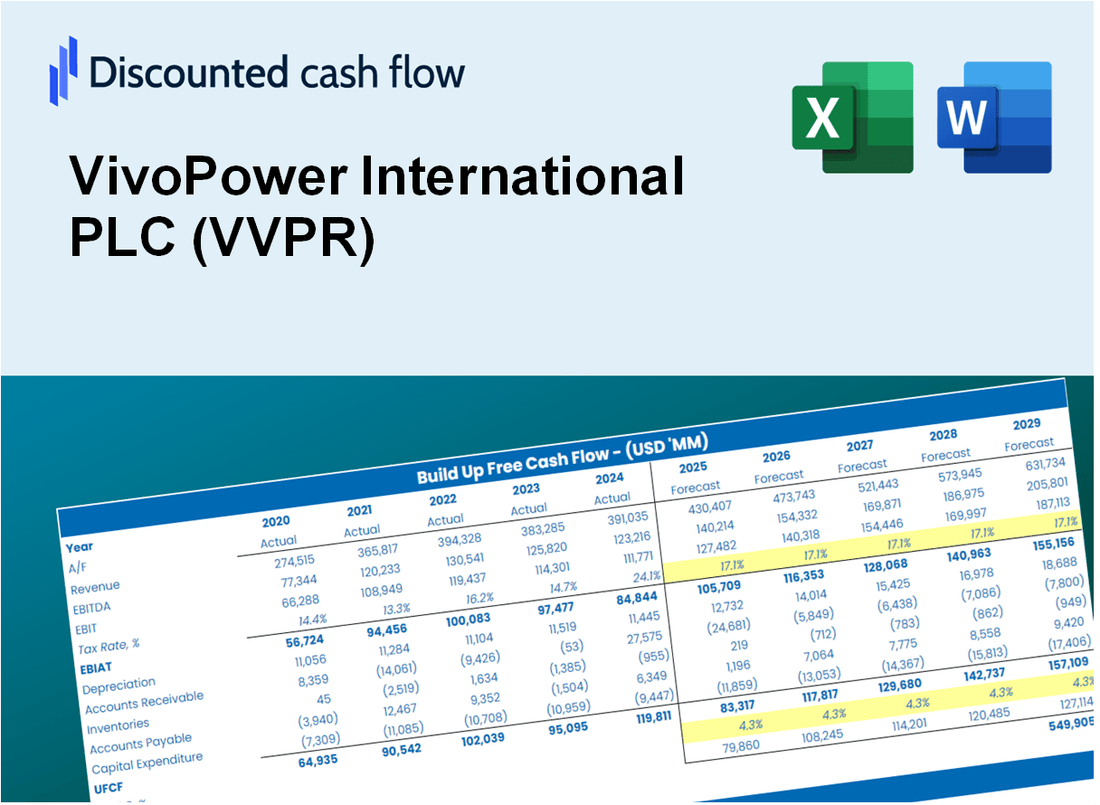
Vivopower International Plc (VVPR) DCF -Bewertung |
Fully Editable: Tailor To Your Needs In Excel Or Sheets
Professional Design: Trusted, Industry-Standard Templates
Investor-Approved Valuation Models
MAC/PC Compatible, Fully Unlocked
No Expertise Is Needed; Easy To Follow
VivoPower International PLC (VVPR) Bundle
Unabhängig davon, ob Sie ein Anleger oder Analyst sind, ist dieser (VVPR) DCF-Taschenrechner Ihr Anlaufwerk für eine genaue Bewertung. Mit echten Daten von Vivopower International PLC vorinstalliert, können Sie Prognosen anpassen und die Auswirkungen sofort beobachten.
What You Will Get
- Real VVPR Financials: Access to historical and projected data for precise valuation.
- Customizable Inputs: Adjust WACC, tax rates, revenue growth, and capital expenditures as needed.
- Instant Calculations: Intrinsic value and NPV are computed in real-time.
- Scenario Analysis: Explore various scenarios to assess VivoPower's future potential.
- User-Friendly Design: Designed for professionals but easy to navigate for newcomers.
Key Features
- Real-Time VVPR Data: Pre-loaded with VivoPower’s historical financial metrics and future projections.
- Comprehensive Customization Options: Modify revenue growth rates, profit margins, discount rates, tax assumptions, and capital investments.
- Interactive Valuation Model: Instant updates to Net Present Value (NPV) and intrinsic value based on your adjustments.
- Scenario Analysis: Develop various forecasting scenarios to explore different valuation possibilities.
- Intuitive User Interface: Easy to navigate, structured for both seasoned professionals and newcomers.
How It Works
- Download: Obtain the pre-configured Excel file containing VivoPower International PLC's (VVPR) financial data.
- Customize: Modify projections, such as revenue growth, EBITDA %, and WACC as per your analysis.
- Update Automatically: The intrinsic value and NPV calculations refresh in real-time.
- Test Scenarios: Develop various projections and instantly compare the results.
- Make Decisions: Leverage the valuation insights to inform your investment approach.
Why Choose This Calculator for VivoPower International PLC (VVPR)?
- Designed for Experts: A sophisticated tool tailored for analysts, CFOs, and consultants.
- Accurate Data: VivoPower’s historical and projected financials are preloaded for precision.
- Flexible Scenario Analysis: Effortlessly simulate various forecasts and assumptions.
- Transparent Results: Automatically computes intrinsic value, NPV, and essential metrics.
- User-Friendly: Step-by-step guidance makes the process straightforward.
Who Should Use This Product?
- Investors: Assess VivoPower's valuation before making stock transactions.
- CFOs and Financial Analysts: Enhance valuation methodologies and evaluate forecasts.
- Startup Founders: Discover how leading public firms like VivoPower are appraised.
- Consultants: Create detailed valuation reports for your clients.
- Students and Educators: Utilize real-time data to learn and teach valuation strategies.
What the VivoPower Template Contains
- Comprehensive DCF Model: Editable template with detailed valuation calculations tailored for VivoPower International PLC (VVPR).
- Real-World Data: VivoPower’s historical and projected financials preloaded for thorough analysis.
- Customizable Parameters: Adjust WACC, growth rates, and tax assumptions to explore various scenarios.
- Financial Statements: Complete annual and quarterly breakdowns for enhanced insights.
- Key Ratios: Integrated analysis for assessing profitability, efficiency, and leverage.
- Dashboard with Visual Outputs: Charts and tables for clear and actionable results.
Disclaimer
All information, articles, and product details provided on this website are for general informational and educational purposes only. We do not claim any ownership over, nor do we intend to infringe upon, any trademarks, copyrights, logos, brand names, or other intellectual property mentioned or depicted on this site. Such intellectual property remains the property of its respective owners, and any references here are made solely for identification or informational purposes, without implying any affiliation, endorsement, or partnership.
We make no representations or warranties, express or implied, regarding the accuracy, completeness, or suitability of any content or products presented. Nothing on this website should be construed as legal, tax, investment, financial, medical, or other professional advice. In addition, no part of this site—including articles or product references—constitutes a solicitation, recommendation, endorsement, advertisement, or offer to buy or sell any securities, franchises, or other financial instruments, particularly in jurisdictions where such activity would be unlawful.
All content is of a general nature and may not address the specific circumstances of any individual or entity. It is not a substitute for professional advice or services. Any actions you take based on the information provided here are strictly at your own risk. You accept full responsibility for any decisions or outcomes arising from your use of this website and agree to release us from any liability in connection with your use of, or reliance upon, the content or products found herein.