
|
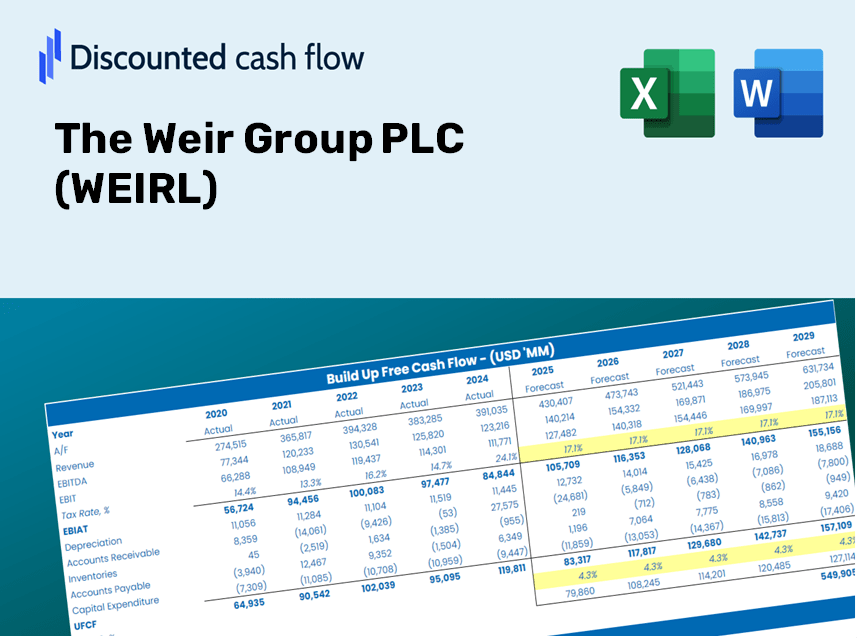
Die DCF -Bewertung der Weir Group Plc (Weir.L) |
Fully Editable: Tailor To Your Needs In Excel Or Sheets
Professional Design: Trusted, Industry-Standard Templates
Investor-Approved Valuation Models
MAC/PC Compatible, Fully Unlocked
No Expertise Is Needed; Easy To Follow
The Weir Group PLC (WEIR.L) Bundle
Unser (Weirl) DCF -Taschenrechner entwickelt für Genauigkeit und ermöglicht es Ihnen, die Bewertung der Weir Group PLC anhand authentischer Finanzdaten zu bewerten, und bietet vollständige Flexibilität, um alle wesentlichen Parameter für verbesserte Projektionen zu ändern.
Discounted Cash Flow (DCF) - (USD MM)
| Year | AY1 2020 |
AY2 2021 |
AY3 2022 |
AY4 2023 |
AY5 2024 |
FY1 2025 |
FY2 2026 |
FY3 2027 |
FY4 2028 |
FY5 2029 |
|---|---|---|---|---|---|---|---|---|---|---|
| Revenue | 1,964.7 | 1,933.6 | 2,472.1 | 2,636.0 | 2,505.6 | 2,680.7 | 2,868.0 | 3,068.4 | 3,282.8 | 3,512.2 |
| Revenue Growth, % | 0 | -1.58 | 27.85 | 6.63 | -4.95 | 6.99 | 6.99 | 6.99 | 6.99 | 6.99 |
| EBITDA | 334.5 | 362.8 | 420.7 | 489.5 | 519.0 | 493.7 | 528.2 | 565.1 | 604.6 | 646.9 |
| EBITDA, % | 17.03 | 18.76 | 17.02 | 18.57 | 20.71 | 18.42 | 18.42 | 18.42 | 18.42 | 18.42 |
| Depreciation | 111.0 | 105.5 | 114.3 | 109.2 | 110.5 | 130.2 | 139.3 | 149.0 | 159.4 | 170.6 |
| Depreciation, % | 5.65 | 5.46 | 4.62 | 4.14 | 4.41 | 4.86 | 4.86 | 4.86 | 4.86 | 4.86 |
| EBIT | 223.5 | 257.3 | 306.4 | 380.3 | 408.5 | 363.5 | 388.9 | 416.1 | 445.2 | 476.3 |
| EBIT, % | 11.38 | 13.31 | 12.39 | 14.43 | 16.3 | 13.56 | 13.56 | 13.56 | 13.56 | 13.56 |
| Total Cash | 351.7 | 564.4 | 691.2 | 707.2 | 556.4 | 665.3 | 711.7 | 761.5 | 814.7 | 871.6 |
| Total Cash, percent | .0 | .0 | .0 | .0 | .0 | .0 | .0 | .0 | .0 | .0 |
| Account Receivables | 425.0 | 438.2 | 530.8 | 430.6 | 472.0 | 541.2 | 579.0 | 619.4 | 662.7 | 709.0 |
| Account Receivables, % | 21.63 | 22.66 | 21.47 | 16.34 | 18.84 | 20.19 | 20.19 | 20.19 | 20.19 | 20.19 |
| Inventories | 443.6 | 516.5 | 679.1 | 608.1 | 580.1 | 659.4 | 705.4 | 754.7 | 807.4 | 863.9 |
| Inventories, % | 22.58 | 26.71 | 27.47 | 23.07 | 23.15 | 24.6 | 24.6 | 24.6 | 24.6 | 24.6 |
| Accounts Payable | 210.7 | 243.1 | 319.3 | 260.1 | 242.1 | 298.9 | 319.7 | 342.1 | 366.0 | 391.6 |
| Accounts Payable, % | 10.72 | 12.57 | 12.92 | 9.87 | 9.66 | 11.15 | 11.15 | 11.15 | 11.15 | 11.15 |
| Capital Expenditure | -71.7 | -52.8 | -62.7 | -86.7 | -72.5 | -81.0 | -86.6 | -92.7 | -99.1 | -106.1 |
| Capital Expenditure, % | -3.65 | -2.73 | -2.54 | -3.29 | -2.89 | -3.02 | -3.02 | -3.02 | -3.02 | -3.02 |
| Tax Rate, % | 10.05 | 10.05 | 10.05 | 10.05 | 10.05 | 10.05 | 10.05 | 10.05 | 10.05 | 10.05 |
| EBITAT | -196.0 | 189.8 | 253.7 | 270.3 | 367.4 | 230.9 | 247.0 | 264.3 | 282.8 | 302.5 |
| Depreciation | ||||||||||
| Changes in Account Receivables | ||||||||||
| Changes in Inventories | ||||||||||
| Changes in Accounts Payable | ||||||||||
| Capital Expenditure | ||||||||||
| UFCF | -814.6 | 188.8 | 126.3 | 404.8 | 374.0 | 188.5 | 236.7 | 253.3 | 271.0 | 289.9 |
| WACC, % | 7.66 | 8.23 | 8.29 | 8.2 | 8.35 | 8.15 | 8.15 | 8.15 | 8.15 | 8.15 |
| PV UFCF | ||||||||||
| SUM PV UFCF | 970.9 | |||||||||
| Long Term Growth Rate, % | 2.00 | |||||||||
| Free cash flow (T + 1) | 296 | |||||||||
| Terminal Value | 4,810 | |||||||||
| Present Terminal Value | 3,251 | |||||||||
| Enterprise Value | 4,222 | |||||||||
| Net Debt | 535 | |||||||||
| Equity Value | 3,688 | |||||||||
| Diluted Shares Outstanding, MM | 260 | |||||||||
| Equity Value Per Share | 1,421.10 |
What You Will Receive
- Customizable Excel Template: An editable Excel-based DCF Calculator featuring real financial data for WEIRL.
- Genuine Data Insights: Includes historical data and forward-looking projections (highlighted in the yellow cells).
- Flexible Forecasting: Adjust forecast assumptions such as revenue growth, EBITDA percentage, and WACC.
- Instant Calculations: Quickly assess the effect of your inputs on the valuation of The Weir Group PLC.
- Professional Resource: Designed for investors, CFOs, consultants, and financial analysts.
- User-Centric Design: Organized for ease of understanding and usability, complete with step-by-step guidance.
Key Features
- Comprehensive Weir Financial Data: Gain access to reliable pre-loaded historical data and future forecasts.
- Adjustable Forecast Parameters: Modify yellow-highlighted cells including WACC, growth rates, and profit margins.
- Automated Calculations: Instant updates to DCF, Net Present Value (NPV), and cash flow assessments.
- User-Friendly Dashboard: Clear and concise charts and summaries for visualizing your valuation outcomes.
- Designed for All Skill Levels: An intuitive layout tailored for investors, CFOs, and consultants alike.
How It Functions
- Step 1: Download the Excel file.
- Step 2: Examine the pre-filled Weir Group data (historical and forecasted).
- Step 3: Modify key assumptions (highlighted in yellow) according to your analysis.
- Step 4: Observe automatic recalculations for Weir Group's intrinsic value.
- Step 5: Utilize the results for investment decisions or reporting.
Why Opt for This Calculator?
- Reliable Data: Authentic Weir Group PLC (WEIRL) financials guarantee trustworthy valuation outcomes.
- Flexible Options: Modify essential variables such as growth rates, WACC, and tax rates to align with your forecasts.
- Time-Efficient: Ready-made calculations save you the hassle of starting from the ground up.
- Professional-Quality Tool: Tailored for investors, analysts, and consultants seeking precision.
- Easy to Use: Streamlined design and clear step-by-step guidance ensure accessibility for every user.
Who Should Utilize This Product?
- Investors: Precisely assess the fair value of Weir Group PLC (WEIRL) prior to making investment choices.
- CFOs: Utilize a top-tier DCF model for comprehensive financial reporting and analysis.
- Consultants: Effortlessly customize the template for client valuation reports.
- Entrepreneurs: Acquire knowledge on financial modeling practices employed by leading companies.
- Educators: Employ it as a resource to illustrate valuation methods in the classroom.
What the Template Contains
- Historical Data: Contains The Weir Group PLC's past financial information and baseline forecasts.
- DCF and Levered DCF Models: Comprehensive templates for calculating the intrinsic value of The Weir Group PLC (WEIRL).
- WACC Sheet: Pre-constructed calculations for the Weighted Average Cost of Capital.
- Editable Inputs: Adjust key parameters such as growth rates, EBITDA percentages, and CAPEX assumptions.
- Quarterly and Annual Statements: A detailed examination of The Weir Group PLC's financials.
- Interactive Dashboard: Dynamically visualize valuation outcomes and projections.
Disclaimer
All information, articles, and product details provided on this website are for general informational and educational purposes only. We do not claim any ownership over, nor do we intend to infringe upon, any trademarks, copyrights, logos, brand names, or other intellectual property mentioned or depicted on this site. Such intellectual property remains the property of its respective owners, and any references here are made solely for identification or informational purposes, without implying any affiliation, endorsement, or partnership.
We make no representations or warranties, express or implied, regarding the accuracy, completeness, or suitability of any content or products presented. Nothing on this website should be construed as legal, tax, investment, financial, medical, or other professional advice. In addition, no part of this site—including articles or product references—constitutes a solicitation, recommendation, endorsement, advertisement, or offer to buy or sell any securities, franchises, or other financial instruments, particularly in jurisdictions where such activity would be unlawful.
All content is of a general nature and may not address the specific circumstances of any individual or entity. It is not a substitute for professional advice or services. Any actions you take based on the information provided here are strictly at your own risk. You accept full responsibility for any decisions or outcomes arising from your use of this website and agree to release us from any liability in connection with your use of, or reliance upon, the content or products found herein.