
|
John Wiley & DCF -Bewertung von Sons, Inc. (WLYB) |
Fully Editable: Tailor To Your Needs In Excel Or Sheets
Professional Design: Trusted, Industry-Standard Templates
Investor-Approved Valuation Models
MAC/PC Compatible, Fully Unlocked
No Expertise Is Needed; Easy To Follow
John Wiley & Sons, Inc. (WLYB) Bundle
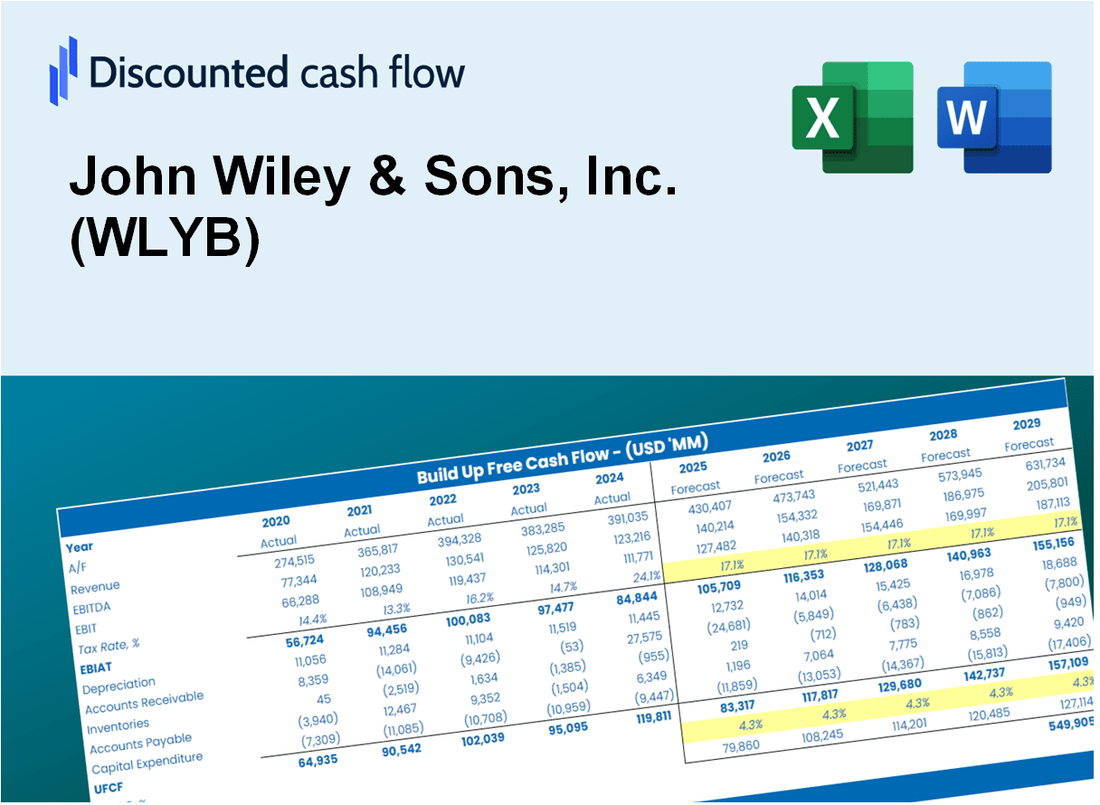
Bewerten Sie John Wiley & Die finanzielle Zukunft von Sons, Inc. (WLYB) wie ein Experte! Dieser (WLYB) DCF-Taschenrechner verfügt über vorgefüllte Finanzdaten und bietet vollständige Flexibilität, um das Umsatzwachstum, WACC, Margen und andere wesentliche Annahmen zu ändern, um sich an Ihren Projektionen auszurichten.
What You Will Get
- Genuine Wiley Data: Preloaded financials – from revenue to EBIT – based on actual and projected figures.
- Complete Customization: Modify all key parameters (yellow cells) such as WACC, growth %, and tax rates.
- Immediate Valuation Updates: Automatic recalculations to assess the impact of changes on Wiley’s fair value.
- Flexible Excel Template: Designed for quick edits, scenario testing, and comprehensive projections.
- Efficient and Precise: Avoid starting from scratch while ensuring accuracy and adaptability.
Key Features
- Comprehensive Data: John Wiley & Sons, Inc.'s historical financial statements and pre-filled projections.
- Customizable Inputs: Modify WACC, tax rates, revenue growth, and EBITDA margins to fit your analysis.
- Real-Time Insights: Observe John Wiley & Sons, Inc.'s intrinsic value update instantly.
- Visual Performance Metrics: Interactive dashboard charts showcase valuation outcomes and essential metrics.
- Designed for Precision: A sophisticated tool tailored for analysts, investors, and finance professionals.
How It Works
- Step 1: Download the Excel file for John Wiley & Sons, Inc. (WLYB).
- Step 2: Review the pre-filled financial data and forecasts for John Wiley & Sons, Inc. (WLYB).
- Step 3: Adjust key inputs such as revenue growth, WACC, and tax rates (highlighted cells) for John Wiley & Sons, Inc. (WLYB).
- Step 4: Observe the DCF model update in real-time as you modify your assumptions for John Wiley & Sons, Inc. (WLYB).
- Step 5: Evaluate the outputs and leverage the results for your investment decisions regarding John Wiley & Sons, Inc. (WLYB).
Why Choose John Wiley & Sons, Inc. (WLYB)?
- Extensive Resources: Access a vast library of educational materials and publications.
- Industry Expertise: Benefit from years of experience in academic and professional publishing.
- Innovative Solutions: Explore cutting-edge tools and technologies to enhance learning.
- Global Reach: Connect with a diverse audience across various fields and disciplines.
- Commitment to Quality: Rely on high standards and rigorous peer review processes for all content.
Who Should Use This Product?
- Students: Explore publishing processes and gain insights into the academic world.
- Researchers: Utilize Wiley's resources to enhance your studies and publications.
- Authors: Discover opportunities to publish and promote your work through a reputable platform.
- Educators: Access a wealth of materials to enrich your teaching and curriculum development.
- Corporate Trainers: Leverage Wiley's expertise to develop training programs and workshops.
What the Template Contains
- Operating and Balance Sheet Data: Pre-filled John Wiley & Sons, Inc. (WLYB) historical data and forecasts, including revenue, EBITDA, EBIT, and capital expenditures.
- WACC Calculation: A dedicated sheet for Weighted Average Cost of Capital (WACC), including parameters like Beta, risk-free rate, and share price.
- DCF Valuation (Unlevered and Levered): Editable Discounted Cash Flow models showing intrinsic value with detailed calculations.
- Financial Statements: Pre-loaded financial statements (annual and quarterly) to support analysis.
- Key Ratios: Includes profitability, leverage, and efficiency ratios for John Wiley & Sons, Inc. (WLYB).
- Dashboard and Charts: Visual summary of valuation outputs and assumptions to analyze results easily.
Disclaimer
All information, articles, and product details provided on this website are for general informational and educational purposes only. We do not claim any ownership over, nor do we intend to infringe upon, any trademarks, copyrights, logos, brand names, or other intellectual property mentioned or depicted on this site. Such intellectual property remains the property of its respective owners, and any references here are made solely for identification or informational purposes, without implying any affiliation, endorsement, or partnership.
We make no representations or warranties, express or implied, regarding the accuracy, completeness, or suitability of any content or products presented. Nothing on this website should be construed as legal, tax, investment, financial, medical, or other professional advice. In addition, no part of this site—including articles or product references—constitutes a solicitation, recommendation, endorsement, advertisement, or offer to buy or sell any securities, franchises, or other financial instruments, particularly in jurisdictions where such activity would be unlawful.
All content is of a general nature and may not address the specific circumstances of any individual or entity. It is not a substitute for professional advice or services. Any actions you take based on the information provided here are strictly at your own risk. You accept full responsibility for any decisions or outcomes arising from your use of this website and agree to release us from any liability in connection with your use of, or reliance upon, the content or products found herein.