
|
Die DCF -Bewertung der Western Union Company (WU) |
Fully Editable: Tailor To Your Needs In Excel Or Sheets
Professional Design: Trusted, Industry-Standard Templates
Investor-Approved Valuation Models
MAC/PC Compatible, Fully Unlocked
No Expertise Is Needed; Easy To Follow
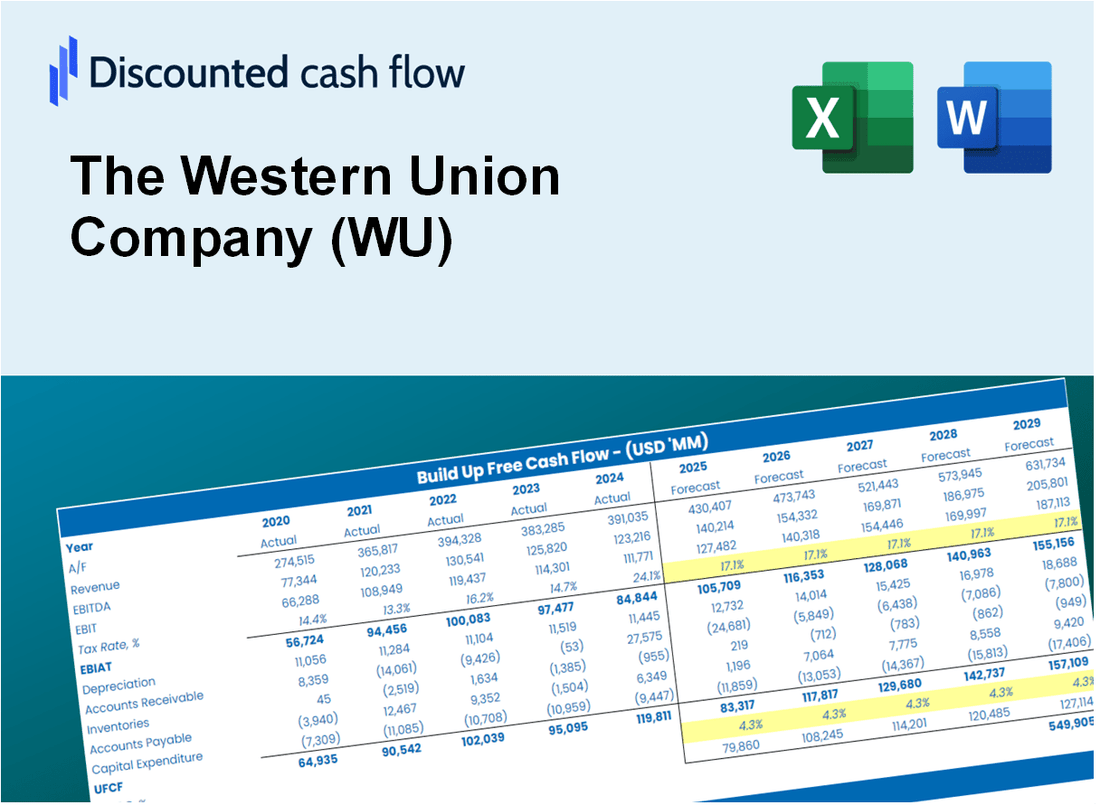
The Western Union Company (WU) Bundle
Unabhängig davon, ob Sie ein Investor oder Analyst sind, ist dieser (WU) DCF -Taschenrechner Ihr wesentliches Werkzeug für eine genaue Bewertung. Mit echten Daten des Western Union Company können Sie Prognosen anpassen und die Auswirkungen in Echtzeit beobachten.
Discounted Cash Flow (DCF) - (USD MM)
| Year | AY1 2020 |
AY2 2021 |
AY3 2022 |
AY4 2023 |
AY5 2024 |
FY1 2025 |
FY2 2026 |
FY3 2027 |
FY4 2028 |
FY5 2029 |
|---|---|---|---|---|---|---|---|---|---|---|
| Revenue | 4,835.0 | 5,070.8 | 4,475.5 | 4,357.0 | 4,209.7 | 4,074.0 | 3,942.7 | 3,815.7 | 3,692.7 | 3,573.7 |
| Revenue Growth, % | 0 | 4.88 | -11.74 | -2.65 | -3.38 | -3.22 | -3.22 | -3.22 | -3.22 | -3.22 |
| EBITDA | 1,199.2 | 1,249.1 | 1,293.4 | 1,034.7 | 917.5 | 1,009.4 | 976.8 | 945.4 | 914.9 | 885.4 |
| EBITDA, % | 24.8 | 24.63 | 28.9 | 23.75 | 21.79 | 24.78 | 24.78 | 24.78 | 24.78 | 24.78 |
| Depreciation | 225.6 | 208.2 | 183.8 | 183.6 | 179.1 | 173.9 | 168.3 | 162.9 | 157.7 | 152.6 |
| Depreciation, % | 4.67 | 4.11 | 4.11 | 4.21 | 4.25 | 4.27 | 4.27 | 4.27 | 4.27 | 4.27 |
| EBIT | 973.6 | 1,040.9 | 1,109.6 | 851.1 | 738.4 | 835.4 | 808.5 | 782.4 | 757.2 | 732.8 |
| EBIT, % | 20.14 | 20.53 | 24.79 | 19.53 | 17.54 | 20.51 | 20.51 | 20.51 | 20.51 | 20.51 |
| Total Cash | 1,428.2 | 1,208.3 | 1,285.9 | 1,268.6 | 1,474.0 | 1,191.5 | 1,153.1 | 1,115.9 | 1,080.0 | 1,045.2 |
| Total Cash, percent | .0 | .0 | .0 | .0 | .0 | .0 | .0 | .0 | .0 | .0 |
| Account Receivables | 1,135.1 | .0 | .0 | .0 | 1,397.0 | 461.7 | 446.8 | 432.4 | 418.5 | 405.0 |
| Account Receivables, % | 23.48 | 0 | 0 | 0 | 33.19 | 11.33 | 11.33 | 11.33 | 11.33 | 11.33 |
| Inventories | 312.3 | .0 | .0 | .0 | .0 | 52.6 | 50.9 | 49.3 | 47.7 | 46.2 |
| Inventories, % | 6.46 | 0 | 0 | 0 | 0 | 1.29 | 1.29 | 1.29 | 1.29 | 1.29 |
| Accounts Payable | 500.9 | 450.2 | 464.0 | 453.0 | 407.9 | 404.9 | 391.8 | 379.2 | 367.0 | 355.2 |
| Accounts Payable, % | 10.36 | 8.88 | 10.37 | 10.4 | 9.69 | 9.94 | 9.94 | 9.94 | 9.94 | 9.94 |
| Capital Expenditure | -156.8 | -214.6 | -208.2 | -147.8 | -37.4 | -133.7 | -129.4 | -125.2 | -121.2 | -117.3 |
| Capital Expenditure, % | -3.24 | -4.23 | -4.65 | -3.39 | -0.88842 | -3.28 | -3.28 | -3.28 | -3.28 | -3.28 |
| Tax Rate, % | -51.02 | -51.02 | -51.02 | -51.02 | -51.02 | -51.02 | -51.02 | -51.02 | -51.02 | -51.02 |
| EBITAT | 847.4 | 896.7 | 1,001.8 | 714.4 | 1,115.1 | 747.6 | 723.5 | 700.1 | 677.6 | 655.7 |
| Depreciation | ||||||||||
| Changes in Account Receivables | ||||||||||
| Changes in Inventories | ||||||||||
| Changes in Accounts Payable | ||||||||||
| Capital Expenditure | ||||||||||
| UFCF | -30.3 | 2,287.0 | 991.2 | 739.2 | -185.3 | 1,667.5 | 765.9 | 741.3 | 717.4 | 694.2 |
| WACC, % | 5.02 | 5.01 | 5.09 | 4.97 | 5.27 | 5.07 | 5.07 | 5.07 | 5.07 | 5.07 |
| PV UFCF | ||||||||||
| SUM PV UFCF | 4,050.5 | |||||||||
| Long Term Growth Rate, % | 2.00 | |||||||||
| Free cash flow (T + 1) | 708 | |||||||||
| Terminal Value | 23,059 | |||||||||
| Present Terminal Value | 18,006 | |||||||||
| Enterprise Value | 22,057 | |||||||||
| Net Debt | 1,658 | |||||||||
| Equity Value | 20,399 | |||||||||
| Diluted Shares Outstanding, MM | 341 | |||||||||
| Equity Value Per Share | 59.80 |
What You Will Get
- Editable Forecast Inputs: Easily modify assumptions (growth %, margins, WACC) to create various scenarios.
- Real-World Data: The Western Union Company’s (WU) financial data pre-filled to kickstart your analysis.
- Automatic DCF Outputs: The template computes Net Present Value (NPV) and intrinsic value for you.
- Customizable and Professional: A refined Excel model that adjusts to your valuation requirements.
- Built for Analysts and Investors: Perfect for testing projections, validating strategies, and saving time.
Key Features
- Real-Life WU Data: Pre-filled with Western Union’s historical financials and forward-looking projections.
- Fully Customizable Inputs: Adjust revenue growth, margins, WACC, tax rates, and capital expenditures.
- Dynamic Valuation Model: Automatic updates to Net Present Value (NPV) and intrinsic value based on your inputs.
- Scenario Testing: Create multiple forecast scenarios to analyze different valuation outcomes.
- User-Friendly Design: Simple, structured, and designed for professionals and beginners alike.
How It Works
- 1. Access the Template: Download and open the Excel file containing Western Union’s preloaded data.
- 2. Adjust Key Inputs: Modify essential variables such as growth rates, WACC, and capital expenditures.
- 3. Instant Results: The DCF model automatically calculates intrinsic value and NPV in real-time.
- 4. Explore Scenarios: Evaluate various forecasts to investigate different valuation possibilities.
- 5. Present with Assurance: Deliver professional valuation insights to bolster your decision-making.
Why Choose This Calculator for The Western Union Company (WU)?
- All-in-One Solution: Combines DCF, WACC, and financial ratio analyses specifically for The Western Union Company (WU).
- Flexible Inputs: Modify yellow-highlighted cells to explore different financial scenarios for The Western Union Company (WU).
- In-Depth Analysis: Automatically computes The Western Union Company (WU)’s intrinsic value and Net Present Value.
- Integrated Data: Comes with historical and projected data to provide reliable starting points for The Western Union Company (WU).
- Expert-Level Tool: Perfect for financial analysts, investors, and business consultants focused on The Western Union Company (WU).
Who Should Use This Product?
- Investors: Make informed decisions with a reliable tool tailored for evaluating currency transfers.
- Financial Analysts: Streamline your analysis with a comprehensive model designed for Western Union's services.
- Consultants: Effortlessly modify the template for client reports or presentations related to international transactions.
- Finance Enthusiasts: Enhance your knowledge of remittance and currency exchange processes with practical examples.
- Educators and Students: Utilize it as a hands-on learning resource in finance and international business courses.
What the Template Contains
- Comprehensive DCF Model: Editable template featuring detailed valuation calculations for The Western Union Company (WU).
- Real-World Data: Historical and projected financials for The Western Union Company (WU) preloaded for analysis.
- Customizable Parameters: Modify WACC, growth rates, and tax assumptions to explore various scenarios.
- Financial Statements: Complete annual and quarterly breakdowns to provide deeper insights into The Western Union Company (WU).
- Key Ratios: Integrated analysis for assessing profitability, efficiency, and leverage specific to The Western Union Company (WU).
- Dashboard with Visual Outputs: Charts and tables designed for clear and actionable insights regarding The Western Union Company (WU).
Disclaimer
All information, articles, and product details provided on this website are for general informational and educational purposes only. We do not claim any ownership over, nor do we intend to infringe upon, any trademarks, copyrights, logos, brand names, or other intellectual property mentioned or depicted on this site. Such intellectual property remains the property of its respective owners, and any references here are made solely for identification or informational purposes, without implying any affiliation, endorsement, or partnership.
We make no representations or warranties, express or implied, regarding the accuracy, completeness, or suitability of any content or products presented. Nothing on this website should be construed as legal, tax, investment, financial, medical, or other professional advice. In addition, no part of this site—including articles or product references—constitutes a solicitation, recommendation, endorsement, advertisement, or offer to buy or sell any securities, franchises, or other financial instruments, particularly in jurisdictions where such activity would be unlawful.
All content is of a general nature and may not address the specific circumstances of any individual or entity. It is not a substitute for professional advice or services. Any actions you take based on the information provided here are strictly at your own risk. You accept full responsibility for any decisions or outcomes arising from your use of this website and agree to release us from any liability in connection with your use of, or reliance upon, the content or products found herein.