
|
XPeng Inc. (XPEV) DCF -Bewertung |
Fully Editable: Tailor To Your Needs In Excel Or Sheets
Professional Design: Trusted, Industry-Standard Templates
Investor-Approved Valuation Models
MAC/PC Compatible, Fully Unlocked
No Expertise Is Needed; Easy To Follow
XPeng Inc. (XPEV) Bundle
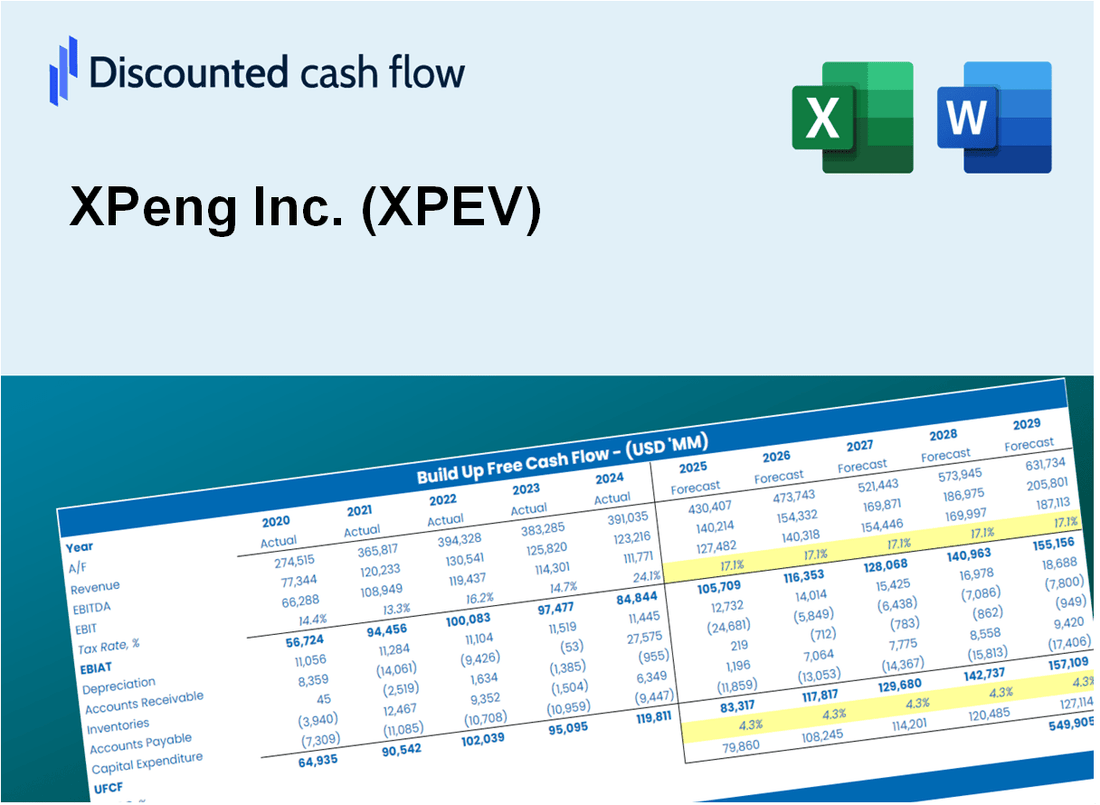
Entdecken Sie das wahre Potenzial von XPeng Inc. (XPEV) mit unserem fortschrittlichen DCF -Taschenrechner! Passen Sie wesentliche Annahmen an, erkunden Sie verschiedene Szenarien und bewerten Sie, wie unterschiedliche Faktoren die Bewertung der XPeng Inc. (XPEV) beeinflussen - alles innerhalb einer umfassenden Excel -Vorlage.
What You Will Receive
- Pre-Filled Financial Model: XPeng Inc.’s actual data facilitates accurate DCF valuation.
- Complete Forecast Control: Modify revenue growth, profit margins, WACC, and other essential metrics.
- Real-Time Calculations: Automatic updates provide immediate results as you make adjustments.
- Investor-Ready Template: A polished Excel file crafted for high-quality valuation.
- Customizable and Reusable: Designed for adaptability, allowing repeated use for comprehensive forecasts.
Key Features
- Pre-Loaded Data: XPeng Inc.'s historical financial statements and pre-filled forecasts.
- Fully Adjustable Inputs: Customize WACC, tax rates, revenue growth, and EBITDA margins.
- Instant Results: View XPeng Inc.'s intrinsic value recalculating in real time.
- Clear Visual Outputs: Dashboard charts illustrate valuation results and key metrics.
- Built for Accuracy: A professional tool designed for analysts, investors, and finance experts.
How It Works
- Step 1: Download the prebuilt Excel template featuring XPeng Inc. (XPEV) data.
- Step 2: Review the pre-filled sheets to familiarize yourself with the essential metrics.
- Step 3: Modify forecasts and assumptions in the editable yellow cells (WACC, growth, margins).
- Step 4: Instantly see the recalculated results, including XPeng Inc.'s intrinsic value.
- Step 5: Make well-informed investment decisions or create reports based on the results.
Why Choose This Calculator for XPeng Inc. (XPEV)?
- User-Friendly Interface: Perfectly tailored for both novice users and seasoned professionals.
- Customizable Inputs: Adjust parameters effortlessly to suit your financial analysis.
- Real-Time Valuation: Observe immediate updates to XPeng’s valuation as you change inputs.
- Preloaded Data: Comes equipped with XPeng’s latest financial information for swift evaluations.
- Relied Upon by Experts: Widely utilized by investors and analysts for informed decision-making.
Who Should Use This Product?
- Professional Investors: Construct precise and dependable valuation models for analyzing portfolios involving XPeng Inc. (XPEV).
- Corporate Finance Teams: Evaluate valuation scenarios to inform strategic decisions within the organization.
- Consultants and Advisors: Deliver clients accurate valuation insights related to XPeng Inc. (XPEV) stock.
- Students and Educators: Utilize real-world data to enhance learning and practice in financial modeling.
- Automotive Enthusiasts: Gain insights into how electric vehicle companies like XPeng Inc. (XPEV) are valued in the financial market.
What the Template Contains
- Historical Data: Includes XPeng Inc.’s (XPEV) past financials and baseline forecasts.
- DCF and Levered DCF Models: Detailed templates to calculate XPeng Inc.’s (XPEV) intrinsic value.
- WACC Sheet: Pre-built calculations for Weighted Average Cost of Capital.
- Editable Inputs: Modify key drivers like growth rates, EBITDA %, and CAPEX assumptions.
- Quarterly and Annual Statements: A complete breakdown of XPeng Inc.’s (XPEV) financials.
- Interactive Dashboard: Visualize valuation results and projections dynamically.
Disclaimer
All information, articles, and product details provided on this website are for general informational and educational purposes only. We do not claim any ownership over, nor do we intend to infringe upon, any trademarks, copyrights, logos, brand names, or other intellectual property mentioned or depicted on this site. Such intellectual property remains the property of its respective owners, and any references here are made solely for identification or informational purposes, without implying any affiliation, endorsement, or partnership.
We make no representations or warranties, express or implied, regarding the accuracy, completeness, or suitability of any content or products presented. Nothing on this website should be construed as legal, tax, investment, financial, medical, or other professional advice. In addition, no part of this site—including articles or product references—constitutes a solicitation, recommendation, endorsement, advertisement, or offer to buy or sell any securities, franchises, or other financial instruments, particularly in jurisdictions where such activity would be unlawful.
All content is of a general nature and may not address the specific circumstances of any individual or entity. It is not a substitute for professional advice or services. Any actions you take based on the information provided here are strictly at your own risk. You accept full responsibility for any decisions or outcomes arising from your use of this website and agree to release us from any liability in connection with your use of, or reliance upon, the content or products found herein.