
|
Expro -Gruppe Holdings N.V. (XPRO) DCF -Bewertung |
Fully Editable: Tailor To Your Needs In Excel Or Sheets
Professional Design: Trusted, Industry-Standard Templates
Investor-Approved Valuation Models
MAC/PC Compatible, Fully Unlocked
No Expertise Is Needed; Easy To Follow
Expro Group Holdings N.V. (XPRO) Bundle
Entdecken Sie den tatsächlichen Wert der Expro -Gruppe Holdings N.V. (XPRO) mit unserem erweiterten DCF -Taschenrechner! Passen Sie die wesentlichen Annahmen an, erkunden Sie verschiedene Szenarien und bewerten Sie, wie unterschiedliche Änderungen die Bewertung der Exprogruppenbestände (XPRO) beeinflussen - alles innerhalb einer umfassenden Excel -Vorlage.
What You Will Get
- Editable Forecast Inputs: Easily modify assumptions (growth %, margins, WACC) to explore various scenarios.
- Real-World Data: Expro Group Holdings N.V. (XPRO)’s financial data pre-filled to kickstart your analysis.
- Automatic DCF Outputs: The template computes Net Present Value (NPV) and intrinsic value automatically.
- Customizable and Professional: A sleek Excel model that adjusts to your valuation requirements.
- Built for Analysts and Investors: Perfect for assessing projections, validating strategies, and optimizing time.
Key Features
- Accurate Expro Financials: Gain access to reliable pre-loaded historical data and future forecasts.
- Adjustable Forecast Parameters: Modify highlighted cells for metrics such as WACC, growth rates, and profit margins.
- Real-Time Calculations: Automatic updates for DCF, Net Present Value (NPV), and cash flow assessments.
- Interactive Dashboard: User-friendly charts and summaries to effectively visualize your valuation outcomes.
- Suitable for All Levels: An intuitive design tailored for investors, CFOs, and consultants alike.
How It Works
- 1. Access the Template: Download and open the Excel file featuring Expro Group Holdings N.V.'s (XPRO) preloaded data.
- 2. Modify Assumptions: Adjust critical inputs such as growth rates, WACC, and capital expenditures.
- 3. View Real-Time Results: The DCF model automatically calculates intrinsic value and NPV based on your inputs.
- 4. Explore Scenarios: Evaluate different forecasts to assess various valuation outcomes.
- 5. Present with Assurance: Deliver professional valuation insights to enhance your decision-making process.
Why Choose This Calculator for Expro Group Holdings N.V. (XPRO)?
- Designed for Experts: A sophisticated tool utilized by analysts, CFOs, and industry consultants.
- Accurate Data: Expro Group's historical and projected financials preloaded for precision.
- Flexible Scenario Analysis: Effortlessly simulate various forecasts and assumptions.
- Comprehensive Outputs: Automatically computes intrinsic value, NPV, and essential metrics.
- User-Friendly: Step-by-step guidance ensures a smooth experience throughout the process.
Who Should Use Expro Group Holdings N.V. (XPRO)?
- Investors: Gain insights and make informed decisions with our industry-leading analytics tools.
- Financial Analysts: Enhance your workflow with customizable financial models tailored for the energy sector.
- Consultants: Effortlessly modify resources for impactful client presentations and strategic reports.
- Energy Sector Enthusiasts: Expand your knowledge of market dynamics through comprehensive case studies.
- Educators and Students: Utilize our resources as a hands-on learning aid in energy finance courses.
What the Template Contains
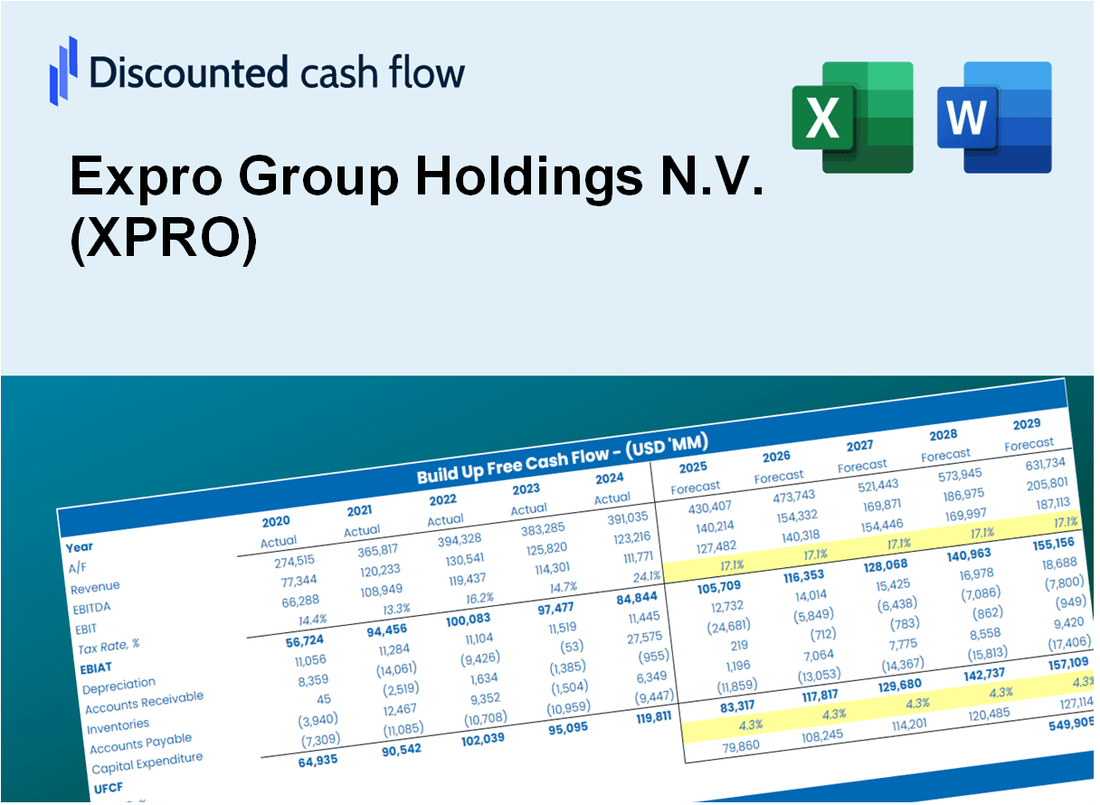
- Operating and Balance Sheet Data: Pre-filled Expro Group Holdings N.V. (XPRO) historical data and forecasts, including revenue, EBITDA, EBIT, and capital expenditures.
- WACC Calculation: A dedicated sheet for Weighted Average Cost of Capital (WACC), featuring parameters such as Beta, risk-free rate, and share price.
- DCF Valuation (Unlevered and Levered): Editable Discounted Cash Flow models illustrating intrinsic value with comprehensive calculations.
- Financial Statements: Pre-loaded financial statements (annual and quarterly) to facilitate analysis.
- Key Ratios: Includes profitability, leverage, and efficiency ratios for Expro Group Holdings N.V. (XPRO).
- Dashboard and Charts: Visual summary of valuation outputs and assumptions to simplify result analysis.
Disclaimer
All information, articles, and product details provided on this website are for general informational and educational purposes only. We do not claim any ownership over, nor do we intend to infringe upon, any trademarks, copyrights, logos, brand names, or other intellectual property mentioned or depicted on this site. Such intellectual property remains the property of its respective owners, and any references here are made solely for identification or informational purposes, without implying any affiliation, endorsement, or partnership.
We make no representations or warranties, express or implied, regarding the accuracy, completeness, or suitability of any content or products presented. Nothing on this website should be construed as legal, tax, investment, financial, medical, or other professional advice. In addition, no part of this site—including articles or product references—constitutes a solicitation, recommendation, endorsement, advertisement, or offer to buy or sell any securities, franchises, or other financial instruments, particularly in jurisdictions where such activity would be unlawful.
All content is of a general nature and may not address the specific circumstances of any individual or entity. It is not a substitute for professional advice or services. Any actions you take based on the information provided here are strictly at your own risk. You accept full responsibility for any decisions or outcomes arising from your use of this website and agree to release us from any liability in connection with your use of, or reliance upon, the content or products found herein.