
|
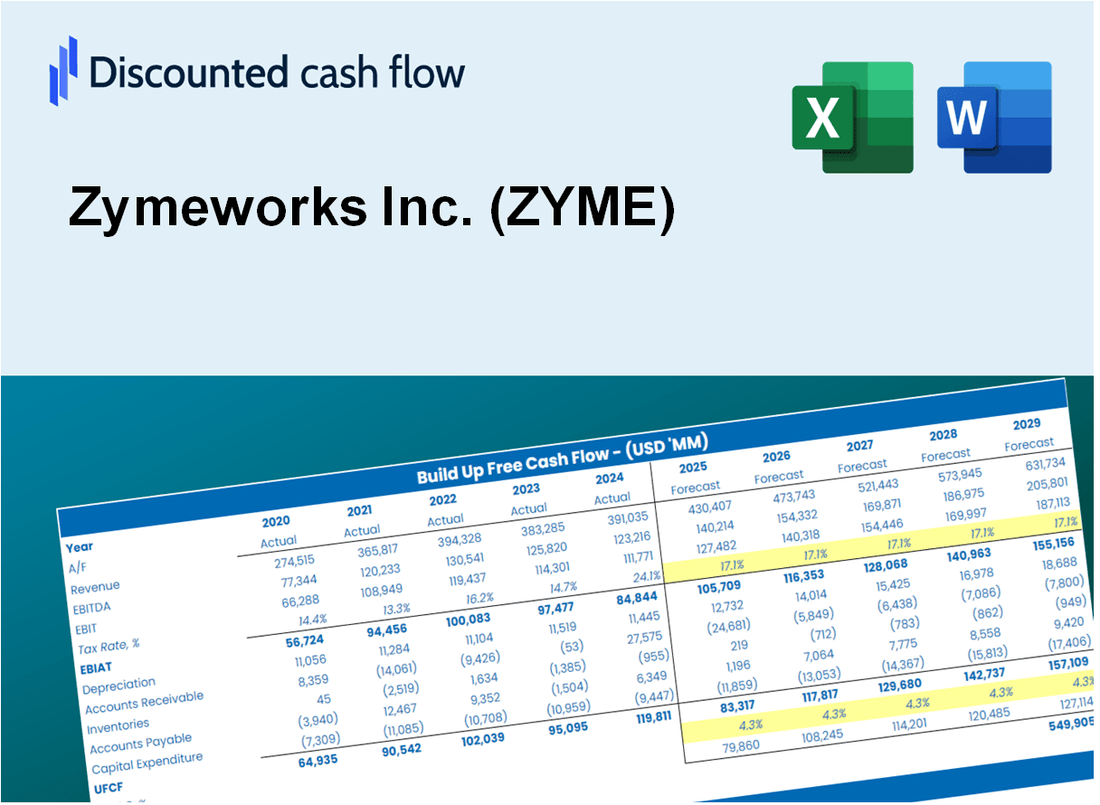
Zymeworks Inc. (Zyme) DCF -Bewertung |
Fully Editable: Tailor To Your Needs In Excel Or Sheets
Professional Design: Trusted, Industry-Standard Templates
Investor-Approved Valuation Models
MAC/PC Compatible, Fully Unlocked
No Expertise Is Needed; Easy To Follow
Zymeworks Inc. (ZYME) Bundle
Gewinnen Sie mit unserem ausgefeilten DCF -Taschenrechner Einblicke in Ihre Zymeworks Inc. (ZYME) -Wundierungsanalyse! Mit dieser Excel -Vorlage können Sie mit realen Zymedaten ausgestattet werden und können Prognosen und Annahmen anpassen, um den intrinsischen Wert von ZymeWorks Inc. mit Genauigkeit zu bestimmen.
What You Will Get
- Editable Forecast Inputs: Easily modify assumptions (growth %, margins, WACC) to explore various scenarios.
- Real-World Data: Zymeworks Inc. (ZYME) financial data pre-filled to facilitate your analysis.
- Automatic DCF Outputs: The template computes Net Present Value (NPV) and intrinsic value automatically.
- Customizable and Professional: A refined Excel model tailored to meet your valuation requirements.
- Built for Analysts and Investors: Perfect for evaluating projections, confirming strategies, and enhancing efficiency.
Key Features
- Comprehensive Data: Zymeworks Inc.'s historical financial statements and pre-filled projections.
- Customizable Parameters: Modify WACC, tax rates, revenue growth, and EBITDA margins as needed.
- Real-Time Insights: Observe Zymeworks Inc.'s intrinsic value recalculating instantly.
- Intuitive Visualizations: Dashboard graphs present valuation outcomes and essential metrics.
- Designed for Precision: A professional-grade tool for analysts, investors, and finance professionals.
How It Functions
- Download the Template: Gain immediate access to the Excel-based Zymeworks Inc. (ZYME) DCF Calculator.
- Input Your Assumptions: Modify the yellow-highlighted cells for growth rates, WACC, margins, and other variables.
- Instant Calculations: The model automatically recalculates Zymeworks Inc.'s intrinsic value.
- Test Scenarios: Experiment with various assumptions to assess potential changes in valuation.
- Analyze and Decide: Utilize the outcomes to inform your investment or financial analysis.
Why Choose This Calculator for Zymeworks Inc. (ZYME)?
- User-Friendly Interface: Perfectly suitable for both novices and seasoned professionals.
- Customizable Inputs: Adjust parameters effortlessly to tailor your financial analysis.
- Real-Time Valuation: Observe immediate updates to Zymeworks' valuation as you change inputs.
- Pre-Loaded Data: Comes with Zymeworks' actual financial information for swift evaluations.
- Relied Upon by Experts: A go-to tool for investors and analysts making strategic decisions.
Who Should Use Zymeworks Inc. (ZYME)?
- Investors: Gain insights into innovative biopharmaceutical solutions with a reliable investment tool.
- Financial Analysts: Streamline your analysis process with a customizable financial model tailored for biotech firms.
- Consultants: Efficiently modify presentations and reports to showcase Zymeworks Inc. (ZYME) to your clients.
- Biotech Enthusiasts: Enhance your knowledge of the industry and its valuation using practical examples from Zymeworks Inc. (ZYME).
- Educators and Students: Utilize it as a hands-on resource for learning about biotechnology and finance in academic settings.
What the Template Contains
- Pre-Filled Data: Contains Zymeworks Inc.'s historical financials and projections.
- Discounted Cash Flow Model: Editable DCF valuation model with automatic calculations.
- Weighted Average Cost of Capital (WACC): A dedicated sheet for calculating WACC based on custom inputs.
- Key Financial Ratios: Analyze Zymeworks Inc.'s profitability, efficiency, and leverage.
- Customizable Inputs: Easily edit revenue growth, margins, and tax rates.
- Clear Dashboard: Charts and tables summarizing key valuation results.
Disclaimer
All information, articles, and product details provided on this website are for general informational and educational purposes only. We do not claim any ownership over, nor do we intend to infringe upon, any trademarks, copyrights, logos, brand names, or other intellectual property mentioned or depicted on this site. Such intellectual property remains the property of its respective owners, and any references here are made solely for identification or informational purposes, without implying any affiliation, endorsement, or partnership.
We make no representations or warranties, express or implied, regarding the accuracy, completeness, or suitability of any content or products presented. Nothing on this website should be construed as legal, tax, investment, financial, medical, or other professional advice. In addition, no part of this site—including articles or product references—constitutes a solicitation, recommendation, endorsement, advertisement, or offer to buy or sell any securities, franchises, or other financial instruments, particularly in jurisdictions where such activity would be unlawful.
All content is of a general nature and may not address the specific circumstances of any individual or entity. It is not a substitute for professional advice or services. Any actions you take based on the information provided here are strictly at your own risk. You accept full responsibility for any decisions or outcomes arising from your use of this website and agree to release us from any liability in connection with your use of, or reliance upon, the content or products found herein.