
|
Máquina herramienta de Qinchuan & Tool Group Share Co., Ltd. (000837.sz) DCF Valoración |
Completamente Editable: Adáptelo A Sus Necesidades En Excel O Sheets
Diseño Profesional: Plantillas Confiables Y Estándares De La Industria
Predeterminadas Para Un Uso Rápido Y Eficiente
Compatible con MAC / PC, completamente desbloqueado
No Se Necesita Experiencia; Fáciles De Seguir
Qinchuan Machine Tool & Tool Group Share Co., Ltd. (000837.SZ) Bundle
Simplificar la máquina herramienta de Qinchuan & ¡Tool Group Share Co., Ltd. Valoración con esta calculadora DCF personalizable! Con una máquina herramienta real de Qinchuan & Tool Group Share Co., Ltd. Financials y entradas de pronóstico ajustable, puede probar escenarios y descubrir la máquina herramienta de Qinchuan & Tool Group Share Co., Ltd. Valor razonable en minutos.
Benefits You Will Receive
- Comprehensive Financial Model: Access to Qinchuan Machine Tool & Tool Group's actual data supports accurate DCF valuation.
- Complete Forecast Flexibility: Modify revenue growth, profit margins, WACC, and other essential parameters.
- Real-Time Calculations: Automatic updates allow you to see outcomes instantly as you make adjustments.
- Professional Grade Template: An expertly crafted Excel file suitable for high-level valuations.
- Customizable and Reusable: Designed for adaptability, enabling multiple uses for in-depth forecasts.
Key Features
- Comprehensive Qinchuan Data: Includes historical financial performance and future projections for Qinchuan Machine Tool & Tool Group Share Co., Ltd. (000837SZ).
- Customizable Financial Inputs: Modify key variables such as revenue growth, profit margins, discount rates, tax rates, and capital expenditures.
- Interactive Valuation Model: Automatically refreshes Net Present Value (NPV) and intrinsic value based on user-defined parameters.
- Forecast Scenario Analysis: Develop various scenarios to evaluate different potential valuation results.
- Intuitive User Interface: Designed to be accessible, structured, and efficient for both seasoned professionals and newcomers.
How It Works
- Step 1: Download the Excel file.
- Step 2: Review the pre-filled data for Qinchuan Machine Tool & Tool Group Share Co., Ltd. (000837SZ), including historical and projected figures.
- Step 3: Modify the key assumptions (highlighted in yellow) according to your analysis.
- Step 4: Observe the automatic recalculations for Qinchuan's intrinsic value.
- Step 5: Utilize the results for investment decisions or reporting purposes.
Why Opt for This Calculator?
- Designed for Industry Experts: A specialized tool utilized by analysts, CFOs, and consultants in the field.
- Accurate Data Integration: Qinchuan Machine Tool & Tool Group's historical and forecasted financials are preloaded for precision.
- Scenario Analysis: Effortlessly simulate various forecasts and assumptions.
- Comprehensive Outputs: Automatically generates intrinsic value, NPV, and key performance indicators.
- User-Friendly Experience: Step-by-step guidance ensures a smooth process.
Who Can Benefit from This Product?
- Manufacturing Students: Understand production techniques and apply them with real-world examples.
- Researchers: Utilize industry-standard models in academic studies or dissertations.
- Investors: Validate your hypotheses and evaluate financial projections for Qinchuan Machine Tool & Tool Group Share Co., Ltd. (000837SZ).
- Market Analysts: Enhance your efficiency with a ready-made, adaptable DCF model.
- Entrepreneurs: Discover how major corporations like Qinchuan Machine Tool are evaluated in the market.
Contents of the Template
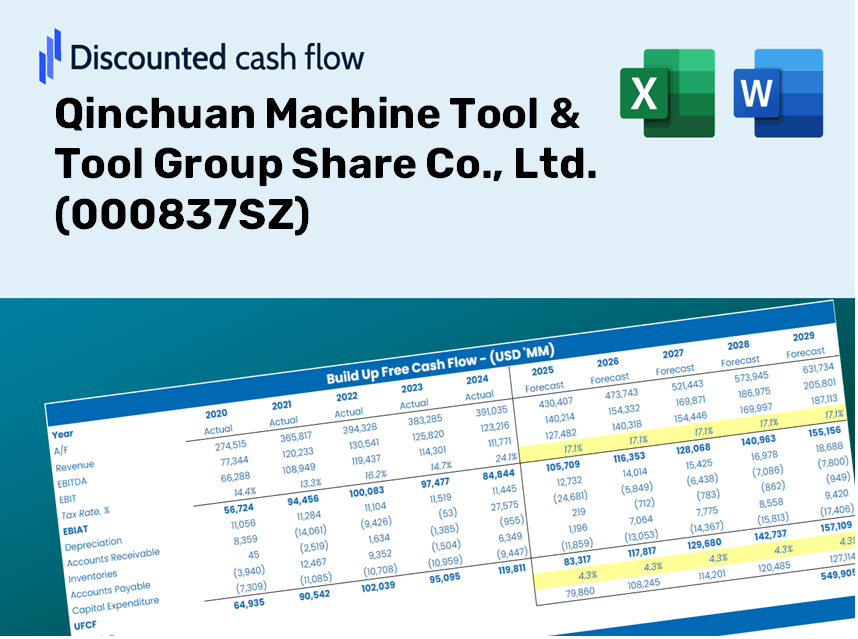
- Operating and Balance Sheet Data: Pre-filled historical data and forecasts for Qinchuan Machine Tool & Tool Group Share Co., Ltd. (000837SZ), including revenue, EBITDA, EBIT, and capital expenditures.
- WACC Calculation: A dedicated sheet for the Weighted Average Cost of Capital (WACC), featuring parameters such as Beta, risk-free rate, and share price.
- DCF Valuation (Unlevered and Levered): Customizable Discounted Cash Flow models that reveal intrinsic value along with detailed calculations.
- Financial Statements: Pre-loaded annual and quarterly financial statements to facilitate comprehensive analysis.
- Key Ratios: Includes profitability, leverage, and efficiency ratios specifically for Qinchuan Machine Tool & Tool Group Share Co., Ltd. (000837SZ).
- Dashboard and Charts: A visual summary of valuation outputs and underlying assumptions for easier result analysis.
Disclaimer
All information, articles, and product details provided on this website are for general informational and educational purposes only. We do not claim any ownership over, nor do we intend to infringe upon, any trademarks, copyrights, logos, brand names, or other intellectual property mentioned or depicted on this site. Such intellectual property remains the property of its respective owners, and any references here are made solely for identification or informational purposes, without implying any affiliation, endorsement, or partnership.
We make no representations or warranties, express or implied, regarding the accuracy, completeness, or suitability of any content or products presented. Nothing on this website should be construed as legal, tax, investment, financial, medical, or other professional advice. In addition, no part of this site—including articles or product references—constitutes a solicitation, recommendation, endorsement, advertisement, or offer to buy or sell any securities, franchises, or other financial instruments, particularly in jurisdictions where such activity would be unlawful.
All content is of a general nature and may not address the specific circumstances of any individual or entity. It is not a substitute for professional advice or services. Any actions you take based on the information provided here are strictly at your own risk. You accept full responsibility for any decisions or outcomes arising from your use of this website and agree to release us from any liability in connection with your use of, or reliance upon, the content or products found herein.