
|
Eternal Asia Supply Chain Management Ltd. (002183.sz) Valoración de DCF |
Completamente Editable: Adáptelo A Sus Necesidades En Excel O Sheets
Diseño Profesional: Plantillas Confiables Y Estándares De La Industria
Predeterminadas Para Un Uso Rápido Y Eficiente
Compatible con MAC / PC, completamente desbloqueado
No Se Necesita Experiencia; Fáciles De Seguir
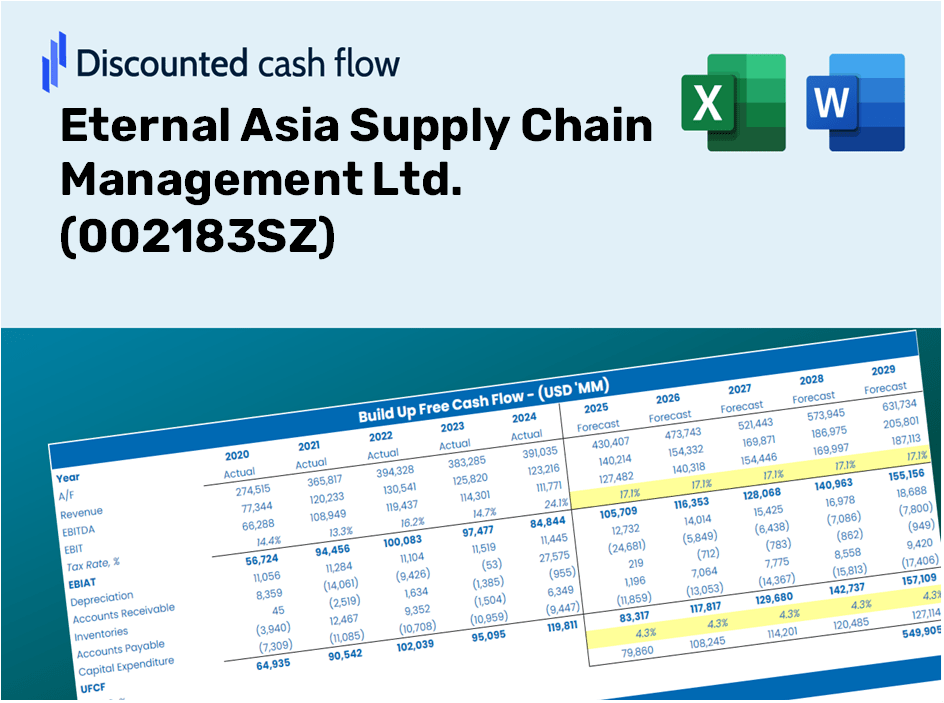
Eternal Asia Supply Chain Management Ltd. (002183.SZ) Bundle
¡Agilice su análisis y mejore la precisión con nuestra calculadora DCF (002183SZ)! Equipado con datos reales de Eternal Asia Supply Chain Management Ltd. y suposiciones personalizables, esta herramienta le permite pronosticar, evaluar y valor (002183SZ) como un inversor experimentado.
Discounted Cash Flow (DCF) - (USD MM)
| Year | AY1 2020 |
AY2 2021 |
AY3 2022 |
AY4 2023 |
AY5 2024 |
FY1 2025 |
FY2 2026 |
FY3 2027 |
FY4 2028 |
FY5 2029 |
|---|---|---|---|---|---|---|---|---|---|---|
| Revenue | 68,256.1 | 70,251.8 | 85,397.7 | 94,422.4 | 77,616.3 | 80,963.9 | 84,456.0 | 88,098.6 | 91,898.4 | 95,862.0 |
| Revenue Growth, % | 0 | 2.92 | 21.56 | 10.57 | -17.8 | 4.31 | 4.31 | 4.31 | 4.31 | 4.31 |
| EBITDA | 1,327.0 | 1,719.8 | 1,548.0 | 1,371.6 | 1,024.5 | 1,453.7 | 1,516.4 | 1,581.8 | 1,650.0 | 1,721.2 |
| EBITDA, % | 1.94 | 2.45 | 1.81 | 1.45 | 1.32 | 1.8 | 1.8 | 1.8 | 1.8 | 1.8 |
| Depreciation | 152.8 | 151.9 | 159.5 | 140.7 | 112.4 | 149.1 | 155.5 | 162.2 | 169.2 | 176.5 |
| Depreciation, % | 0.22381 | 0.21624 | 0.18681 | 0.14904 | 0.14483 | 0.18415 | 0.18415 | 0.18415 | 0.18415 | 0.18415 |
| EBIT | 1,174.2 | 1,567.9 | 1,388.5 | 1,230.8 | 912.1 | 1,304.6 | 1,360.9 | 1,419.6 | 1,480.8 | 1,544.7 |
| EBIT, % | 1.72 | 2.23 | 1.63 | 1.3 | 1.18 | 1.61 | 1.61 | 1.61 | 1.61 | 1.61 |
| Total Cash | 10,431.2 | 9,445.4 | 14,127.1 | 13,730.1 | 13,298.9 | 12,459.6 | 12,997.0 | 13,557.6 | 14,142.4 | 14,752.3 |
| Total Cash, percent | .0 | .0 | .0 | .0 | .0 | .0 | .0 | .0 | .0 | .0 |
| Account Receivables | 14,176.0 | 16,015.9 | 16,656.3 | 18,651.8 | 22,504.1 | 18,106.6 | 18,887.5 | 19,702.1 | 20,551.9 | 21,438.3 |
| Account Receivables, % | 20.77 | 22.8 | 19.5 | 19.75 | 28.99 | 22.36 | 22.36 | 22.36 | 22.36 | 22.36 |
| Inventories | 5,814.8 | 5,437.1 | 6,847.1 | 7,458.0 | 7,107.2 | 6,692.8 | 6,981.4 | 7,282.5 | 7,596.6 | 7,924.3 |
| Inventories, % | 8.52 | 7.74 | 8.02 | 7.9 | 9.16 | 8.27 | 8.27 | 8.27 | 8.27 | 8.27 |
| Accounts Payable | 7,353.3 | 1,537.3 | 14,227.9 | 5,896.8 | 17,222.9 | 9,401.1 | 9,806.6 | 10,229.5 | 10,670.7 | 11,131.0 |
| Accounts Payable, % | 10.77 | 2.19 | 16.66 | 6.25 | 22.19 | 11.61 | 11.61 | 11.61 | 11.61 | 11.61 |
| Capital Expenditure | -255.6 | -455.2 | -753.0 | -653.8 | -330.6 | -489.4 | -510.5 | -532.5 | -555.5 | -579.5 |
| Capital Expenditure, % | -0.37442 | -0.64791 | -0.88172 | -0.69243 | -0.4259 | -0.60448 | -0.60448 | -0.60448 | -0.60448 | -0.60448 |
| Tax Rate, % | -61.12 | -61.12 | -61.12 | -61.12 | -61.12 | -61.12 | -61.12 | -61.12 | -61.12 | -61.12 |
| EBITAT | 1,447.0 | 1,473.2 | 1,203.6 | 1,075.6 | 1,469.6 | 1,221.2 | 1,273.9 | 1,328.8 | 1,386.1 | 1,445.9 |
| Depreciation | ||||||||||
| Changes in Account Receivables | ||||||||||
| Changes in Inventories | ||||||||||
| Changes in Accounts Payable | ||||||||||
| Capital Expenditure | ||||||||||
| UFCF | -11,293.2 | -6,108.4 | 11,250.5 | -10,375.1 | 9,076.2 | -2,129.0 | 254.7 | 265.7 | 277.2 | 289.1 |
| WACC, % | 5.62 | 5.41 | 5.16 | 5.19 | 5.62 | 5.4 | 5.4 | 5.4 | 5.4 | 5.4 |
| PV UFCF | ||||||||||
| SUM PV UFCF | -1,116.9 | |||||||||
| Long Term Growth Rate, % | 3.50 | |||||||||
| Free cash flow (T + 1) | 299 | |||||||||
| Terminal Value | 15,749 | |||||||||
| Present Terminal Value | 12,107 | |||||||||
| Enterprise Value | 10,990 | |||||||||
| Net Debt | 12,506 | |||||||||
| Equity Value | -1,516 | |||||||||
| Diluted Shares Outstanding, MM | 2,646 | |||||||||
| Equity Value Per Share | -0.57 |
Benefits You Will Receive
- Authentic Eternal Asia Data: Comprehensive financial metrics – including revenue and EBIT – derived from actual and anticipated figures.
- Complete Customization: Modify all essential parameters (yellow cells) such as WACC, growth %, and tax rates to fit your analysis.
- Real-Time Valuation Adjustments: Automatic recalculations to assess the effects of modifications on the fair value of Eternal Asia Supply Chain Management Ltd. (002183SZ).
- Flexible Excel Template: Designed for quick adjustments, scenario analysis, and in-depth forecasting.
- Efficient and Precise: Avoid the hassle of constructing models from the ground up while ensuring accuracy and adaptability.
Key Features
- Comprehensive Data: Eternal Asia's historical financial records and pre-set forecasts.
- Customizable Parameters: Modify WACC, tax rates, revenue growth, and EBITDA margins as needed.
- Immediate Insights: Watch the intrinsic value of Eternal Asia (002183SZ) update in real time.
- Visual Clarity: Dashboard graphs present valuation outcomes and essential metrics in an easy-to-understand format.
- Designed for Precision: A specialized tool tailored for analysts, investors, and finance professionals.
How It Works
- Step 1: Download the Excel file.
- Step 2: Examine Eternal Asia's pre-filled financial data and projections.
- Step 3: Adjust key variables such as revenue growth, WACC, and tax rates (highlighted cells).
- Step 4: Observe the DCF model refresh in real-time as you modify your assumptions.
- Step 5: Evaluate the results and apply them for your investment strategies.
Why Choose This Calculator for Eternal Asia Supply Chain Management Ltd. (002183SZ)?
- User-Friendly Interface: Designed to be accessible for both newcomers and seasoned professionals.
- Customizable Inputs: Adjust parameters effortlessly to tailor your analysis.
- Real-Time Adjustments: Instantly view updates to Eternal Asia's valuation as you modify your entries.
- Preloaded Data: Comes with comprehensive financial information for Eternal Asia, enabling quick assessments.
- Relied Upon by Experts: Utilized by investors and analysts for making well-informed decisions.
Who Can Benefit from Our Services?
- Supply Chain Professionals: Develop comprehensive strategies for optimizing logistics and operations.
- Corporate Procurement Teams: Evaluate supplier options to enhance cost-effectiveness and efficiency.
- Consultants and Advisors: Deliver precise insights into supply chain dynamics for clients associated with Eternal Asia Supply Chain Management Ltd. (002183SZ).
- Students and Educators: Utilize real-world case studies to learn and teach best practices in supply chain management.
- Business Analysts: Gain insights into the operational frameworks of supply chain leaders like Eternal Asia Supply Chain Management Ltd. (002183SZ).
Contents of the Template
- Historical Data: Features Eternal Asia’s past financial performance and foundational forecasts.
- DCF and Levered DCF Models: Comprehensive templates designed to assess Eternal Asia’s intrinsic value.
- WACC Sheet: Ready-to-use calculations for Weighted Average Cost of Capital.
- Editable Inputs: Adjust crucial variables such as growth rates, EBITDA %, and CAPEX assumptions.
- Quarterly and Annual Statements: An exhaustive overview of Eternal Asia’s financial results.
- Interactive Dashboard: Dynamically visualize valuation outcomes and forecasts.
Disclaimer
All information, articles, and product details provided on this website are for general informational and educational purposes only. We do not claim any ownership over, nor do we intend to infringe upon, any trademarks, copyrights, logos, brand names, or other intellectual property mentioned or depicted on this site. Such intellectual property remains the property of its respective owners, and any references here are made solely for identification or informational purposes, without implying any affiliation, endorsement, or partnership.
We make no representations or warranties, express or implied, regarding the accuracy, completeness, or suitability of any content or products presented. Nothing on this website should be construed as legal, tax, investment, financial, medical, or other professional advice. In addition, no part of this site—including articles or product references—constitutes a solicitation, recommendation, endorsement, advertisement, or offer to buy or sell any securities, franchises, or other financial instruments, particularly in jurisdictions where such activity would be unlawful.
All content is of a general nature and may not address the specific circumstances of any individual or entity. It is not a substitute for professional advice or services. Any actions you take based on the information provided here are strictly at your own risk. You accept full responsibility for any decisions or outcomes arising from your use of this website and agree to release us from any liability in connection with your use of, or reliance upon, the content or products found herein.