
|
Wuhan Fingu Electronic Technology Co., Ltd. (002194.sz) valoración de DCF |
Completamente Editable: Adáptelo A Sus Necesidades En Excel O Sheets
Diseño Profesional: Plantillas Confiables Y Estándares De La Industria
Predeterminadas Para Un Uso Rápido Y Eficiente
Compatible con MAC / PC, completamente desbloqueado
No Se Necesita Experiencia; Fáciles De Seguir
Wuhan Fingu Electronic Technology Co., LTD. (002194.SZ) Bundle
Explore el futuro financiero de Wuhan Fingu Electronic Technology Co., Ltd. (002194SZ) ¡Con nuestra calculadora DCF fácil de usar! Ingrese sus suposiciones con respecto al crecimiento, los márgenes y los gastos para determinar el valor intrínseco de Wuhan Fingu Electronic Technology Co., Ltd. (002194sz) y refine su enfoque de inversión.
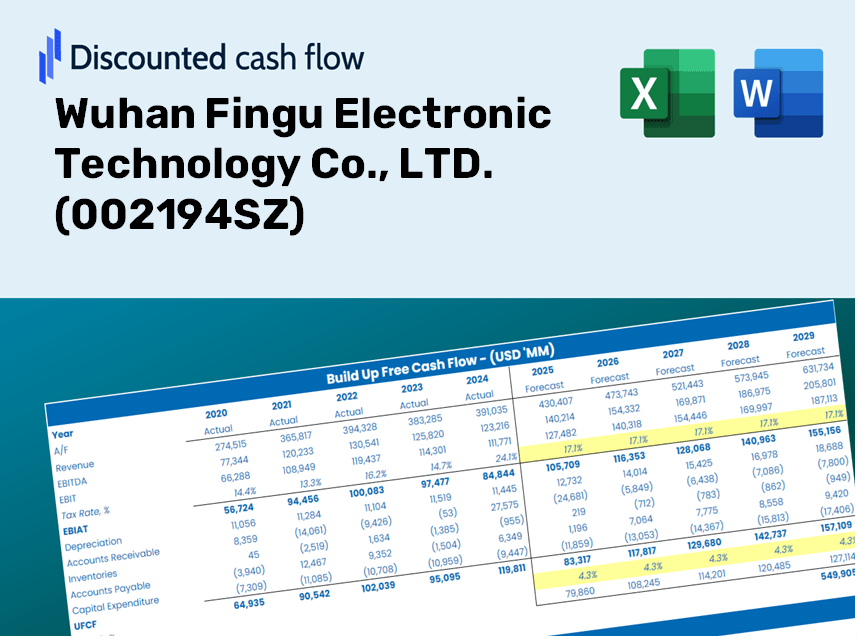
Discounted Cash Flow (DCF) - (USD MM)
| Year | AY1 2020 |
AY2 2021 |
AY3 2022 |
AY4 2023 |
AY5 2024 |
FY1 2025 |
FY2 2026 |
FY3 2027 |
FY4 2028 |
FY5 2029 |
|---|---|---|---|---|---|---|---|---|---|---|
| Revenue | 1,491.7 | 1,837.5 | 2,073.1 | 1,587.6 | 1,482.4 | 1,504.5 | 1,526.9 | 1,549.6 | 1,572.7 | 1,596.1 |
| Revenue Growth, % | 0 | 23.18 | 12.82 | -23.42 | -6.63 | 1.49 | 1.49 | 1.49 | 1.49 | 1.49 |
| EBITDA | 238.7 | 264.1 | 285.7 | 140.9 | 96.7 | 179.2 | 181.8 | 184.6 | 187.3 | 190.1 |
| EBITDA, % | 16 | 14.37 | 13.78 | 8.87 | 6.52 | 11.91 | 11.91 | 11.91 | 11.91 | 11.91 |
| Depreciation | 66.0 | 58.6 | 67.3 | 83.7 | 89.3 | 66.7 | 67.7 | 68.7 | 69.7 | 70.7 |
| Depreciation, % | 4.42 | 3.19 | 3.25 | 5.27 | 6.03 | 4.43 | 4.43 | 4.43 | 4.43 | 4.43 |
| EBIT | 172.7 | 205.4 | 218.3 | 57.2 | 7.4 | 112.5 | 114.2 | 115.9 | 117.6 | 119.3 |
| EBIT, % | 11.58 | 11.18 | 10.53 | 3.6 | 0.49727 | 7.48 | 7.48 | 7.48 | 7.48 | 7.48 |
| Total Cash | 1,208.1 | 1,436.4 | 1,547.6 | 1,516.1 | 1,425.9 | 1,280.3 | 1,299.3 | 1,318.7 | 1,338.3 | 1,358.2 |
| Total Cash, percent | .0 | .0 | .0 | .0 | .0 | .0 | .0 | .0 | .0 | .0 |
| Account Receivables | 493.8 | 487.9 | 510.0 | 342.8 | 435.8 | 406.9 | 413.0 | 419.2 | 425.4 | 431.7 |
| Account Receivables, % | 33.1 | 26.55 | 24.6 | 21.59 | 29.4 | 27.05 | 27.05 | 27.05 | 27.05 | 27.05 |
| Inventories | 274.5 | 338.8 | 400.1 | 274.0 | 355.7 | 293.1 | 297.4 | 301.8 | 306.3 | 310.9 |
| Inventories, % | 18.4 | 18.44 | 19.3 | 17.26 | 24 | 19.48 | 19.48 | 19.48 | 19.48 | 19.48 |
| Accounts Payable | 365.9 | 448.1 | 371.4 | 276.7 | 180.0 | 290.1 | 294.4 | 298.8 | 303.2 | 307.7 |
| Accounts Payable, % | 24.53 | 24.38 | 17.91 | 17.43 | 12.14 | 19.28 | 19.28 | 19.28 | 19.28 | 19.28 |
| Capital Expenditure | -62.3 | -63.7 | -155.7 | -160.9 | -92.5 | -94.9 | -96.3 | -97.7 | -99.2 | -100.6 |
| Capital Expenditure, % | -4.18 | -3.46 | -7.51 | -10.14 | -6.24 | -6.31 | -6.31 | -6.31 | -6.31 | -6.31 |
| Tax Rate, % | -32.2 | -32.2 | -32.2 | -32.2 | -32.2 | -32.2 | -32.2 | -32.2 | -32.2 | -32.2 |
| EBITAT | 171.9 | 197.5 | 219.0 | 45.8 | 9.7 | 107.1 | 108.7 | 110.3 | 111.9 | 113.6 |
| Depreciation | ||||||||||
| Changes in Account Receivables | ||||||||||
| Changes in Inventories | ||||||||||
| Changes in Accounts Payable | ||||||||||
| Capital Expenditure | ||||||||||
| UFCF | -226.8 | 216.3 | -29.6 | 167.4 | -264.8 | 280.5 | 74.0 | 75.1 | 76.2 | 77.3 |
| WACC, % | 5.03 | 5.02 | 5.03 | 5.02 | 5.03 | 5.02 | 5.02 | 5.02 | 5.02 | 5.02 |
| PV UFCF | ||||||||||
| SUM PV UFCF | 522.0 | |||||||||
| Long Term Growth Rate, % | 2.00 | |||||||||
| Free cash flow (T + 1) | 79 | |||||||||
| Terminal Value | 2,607 | |||||||||
| Present Terminal Value | 2,041 | |||||||||
| Enterprise Value | 2,563 | |||||||||
| Net Debt | -1,421 | |||||||||
| Equity Value | 3,983 | |||||||||
| Diluted Shares Outstanding, MM | 684 | |||||||||
| Equity Value Per Share | 5.83 |
Benefits You Will Receive
- Pre-Configured Financial Model: Leverage Wuhan Fingu Electronic Technology Co., LTD.'s (002194SZ) actual data for accurate DCF valuation.
- Comprehensive Forecasting Control: Fine-tune revenue growth, profit margins, WACC, and other essential parameters.
- Real-Time Calculations: Automatic updates provide immediate results as you adjust inputs.
- Professionally Designed Template: A polished Excel file tailored for high-standard valuation presentations.
- Flexible and Reusable: Crafted for adaptability, allowing for ongoing use in detailed forecasting scenarios.
Key Features
- Real-Time Data for Wuhan Fingu: Pre-loaded with the company's historical financial performance and future growth projections.
- Customizable Assumptions: Modify inputs such as revenue growth rates, profit margins, WACC, tax rates, and capital expenditure plans.
- Interactive Valuation Model: Instantaneous recalculations of Net Present Value (NPV) and intrinsic value reflective of your specific inputs.
- Scenario Analysis: Generate various forecasting scenarios to explore different potential valuation results.
- User-Centric Interface: Intuitive layout tailored for both industry professionals and newcomers.
How It Works
- Step 1: Download the Excel file.
- Step 2: Review the pre-filled data for Wuhan Fingu Electronic Technology Co., LTD. (002194SZ) (historical and projected).
- Step 3: Modify key assumptions (highlighted in yellow) based on your analysis.
- Step 4: Observe automatic recalculations for the intrinsic value of Wuhan Fingu Electronic Technology Co., LTD. (002194SZ).
- Step 5: Utilize the results for investment decisions or reporting purposes.
Why Opt for This Calculator?
- User-Friendly Interface: Perfect for both novices and seasoned users.
- Customizable Inputs: Easily adjust variables to suit your specific analysis.
- Real-Time Feedback: Witness immediate changes in Wuhan Fingu’s valuation as you tweak the inputs.
- Pre-Configured Data: Comes preloaded with Wuhan Fingu’s actual financial figures for swift evaluations.
- Relied Upon by Experts: A go-to tool for investors and analysts for making well-informed choices.
Who Can Benefit from This Product?
- Investors: Assess Wuhan Fingu Electronic Technology Co., LTD.'s ([002194SZ]) valuation before making stock trades.
- CFOs and Financial Analysts: Optimize valuation processes and evaluate financial forecasts for ([002194SZ]).
- Startup Founders: Understand the valuation methods used for established companies like Wuhan Fingu ([002194SZ]).
- Consultants: Provide accurate valuation reports for clients involving ([002194SZ]).
- Students and Educators: Utilize real data from ([002194SZ]) to practice and teach valuation strategies.
What the Template Contains
- Historical Data: Includes Wuhan Fingu Electronic Technology Co., LTD.'s past financials and baseline forecasts.
- DCF and Levered DCF Models: Detailed templates to calculate the intrinsic value of Wuhan Fingu Electronic Technology Co., LTD. (002194SZ).
- WACC Sheet: Pre-built calculations for Weighted Average Cost of Capital.
- Editable Inputs: Modify key drivers such as growth rates, EBITDA %, and CAPEX assumptions.
- Quarterly and Annual Statements: A complete breakdown of Wuhan Fingu Electronic Technology Co., LTD.'s financials.
- Interactive Dashboard: Visualize valuation results and projections dynamically.
Disclaimer
All information, articles, and product details provided on this website are for general informational and educational purposes only. We do not claim any ownership over, nor do we intend to infringe upon, any trademarks, copyrights, logos, brand names, or other intellectual property mentioned or depicted on this site. Such intellectual property remains the property of its respective owners, and any references here are made solely for identification or informational purposes, without implying any affiliation, endorsement, or partnership.
We make no representations or warranties, express or implied, regarding the accuracy, completeness, or suitability of any content or products presented. Nothing on this website should be construed as legal, tax, investment, financial, medical, or other professional advice. In addition, no part of this site—including articles or product references—constitutes a solicitation, recommendation, endorsement, advertisement, or offer to buy or sell any securities, franchises, or other financial instruments, particularly in jurisdictions where such activity would be unlawful.
All content is of a general nature and may not address the specific circumstances of any individual or entity. It is not a substitute for professional advice or services. Any actions you take based on the information provided here are strictly at your own risk. You accept full responsibility for any decisions or outcomes arising from your use of this website and agree to release us from any liability in connection with your use of, or reliance upon, the content or products found herein.