
|
Chow Tai Seng Jewelery Co., Ltd. (002867.sz) DCF Valoración |
Completamente Editable: Adáptelo A Sus Necesidades En Excel O Sheets
Diseño Profesional: Plantillas Confiables Y Estándares De La Industria
Predeterminadas Para Un Uso Rápido Y Eficiente
Compatible con MAC / PC, completamente desbloqueado
No Se Necesita Experiencia; Fáciles De Seguir
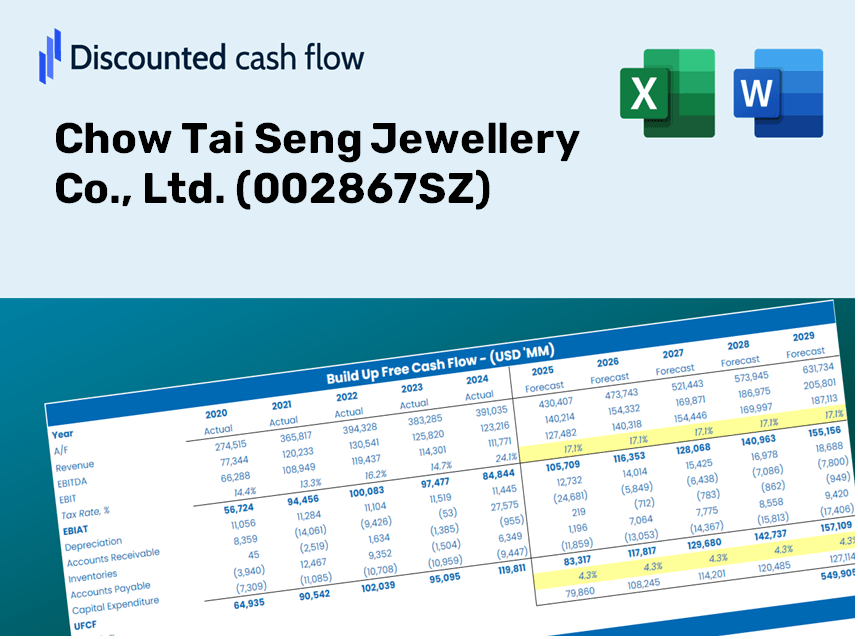
Chow Tai Seng Jewellery Co., Ltd. (002867.SZ) Bundle
Si usted es un inversor o analista, esta calculadora DCF (002867SZ) DCF es su recurso de referencia para una valoración precisa. Cargados con datos reales de Chow Tai Seng Jewelery Co., Ltd., puede ajustar los pronósticos y observar los efectos en tiempo real.
Discounted Cash Flow (DCF) - (USD MM)
| Year | AY1 2020 |
AY2 2021 |
AY3 2022 |
AY4 2023 |
AY5 2024 |
FY1 2025 |
FY2 2026 |
FY3 2027 |
FY4 2028 |
FY5 2029 |
|---|---|---|---|---|---|---|---|---|---|---|
| Revenue | 5,084.1 | 9,155.2 | 11,118.1 | 16,290.1 | 13,891.3 | 14,261.6 | 14,641.8 | 15,032.2 | 15,432.9 | 15,844.3 |
| Revenue Growth, % | 0 | 80.07 | 21.44 | 46.52 | -14.73 | 2.67 | 2.67 | 2.67 | 2.67 | 2.67 |
| EBITDA | 1,258.0 | 1,525.5 | 1,365.3 | 1,752.3 | 1,456.0 | 2,137.1 | 2,194.0 | 2,252.5 | 2,312.6 | 2,374.2 |
| EBITDA, % | 24.74 | 16.66 | 12.28 | 10.76 | 10.48 | 14.98 | 14.98 | 14.98 | 14.98 | 14.98 |
| Depreciation | 13.2 | 13.1 | 14.3 | 12.6 | 25.6 | 22.6 | 23.2 | 23.8 | 24.4 | 25.1 |
| Depreciation, % | 0.25906 | 0.14263 | 0.12845 | 0.0774476 | 0.18412 | 0.15834 | 0.15834 | 0.15834 | 0.15834 | 0.15834 |
| EBIT | 1,244.8 | 1,512.5 | 1,351.0 | 1,739.7 | 1,430.4 | 2,114.5 | 2,170.9 | 2,228.7 | 2,288.1 | 2,349.1 |
| EBIT, % | 24.48 | 16.52 | 12.15 | 10.68 | 10.3 | 14.83 | 14.83 | 14.83 | 14.83 | 14.83 |
| Total Cash | 1,680.4 | 1,289.3 | 1,735.4 | 851.8 | 1,157.6 | 2,176.5 | 2,234.5 | 2,294.1 | 2,355.3 | 2,418.0 |
| Total Cash, percent | .0 | .0 | .0 | .0 | .0 | .0 | .0 | .0 | .0 | .0 |
| Account Receivables | 135.7 | 682.9 | 859.3 | 1,564.8 | 341.9 | 853.5 | 876.3 | 899.6 | 923.6 | 948.3 |
| Account Receivables, % | 2.67 | 7.46 | 7.73 | 9.61 | 2.46 | 5.98 | 5.98 | 5.98 | 5.98 | 5.98 |
| Inventories | 2,391.4 | 2,747.7 | 3,342.4 | 3,642.8 | 4,270.2 | 4,569.8 | 4,691.6 | 4,816.7 | 4,945.1 | 5,076.9 |
| Inventories, % | 47.04 | 30.01 | 30.06 | 22.36 | 30.74 | 32.04 | 32.04 | 32.04 | 32.04 | 32.04 |
| Accounts Payable | 422.6 | 344.7 | 271.2 | 148.5 | 174.0 | 475.8 | 488.5 | 501.5 | 514.9 | 528.6 |
| Accounts Payable, % | 8.31 | 3.76 | 2.44 | 0.91186 | 1.25 | 3.34 | 3.34 | 3.34 | 3.34 | 3.34 |
| Capital Expenditure | -136.9 | -154.0 | -122.5 | -214.7 | -195.3 | -233.9 | -240.1 | -246.5 | -253.1 | -259.8 |
| Capital Expenditure, % | -2.69 | -1.68 | -1.1 | -1.32 | -1.41 | -1.64 | -1.64 | -1.64 | -1.64 | -1.64 |
| Tax Rate, % | 21.78 | 21.78 | 21.78 | 21.78 | 21.78 | 21.78 | 21.78 | 21.78 | 21.78 | 21.78 |
| EBITAT | 952.8 | 1,164.5 | 1,037.5 | 1,340.2 | 1,118.8 | 1,630.6 | 1,674.1 | 1,718.7 | 1,764.5 | 1,811.6 |
| Depreciation | ||||||||||
| Changes in Account Receivables | ||||||||||
| Changes in Inventories | ||||||||||
| Changes in Accounts Payable | ||||||||||
| Capital Expenditure | ||||||||||
| UFCF | -1,275.4 | 42.1 | 84.6 | 9.7 | 1,569.9 | 909.9 | 1,325.2 | 1,360.6 | 1,396.8 | 1,434.1 |
| WACC, % | 6.23 | 6.23 | 6.23 | 6.23 | 6.24 | 6.23 | 6.23 | 6.23 | 6.23 | 6.23 |
| PV UFCF | ||||||||||
| SUM PV UFCF | 5,322.1 | |||||||||
| Long Term Growth Rate, % | 3.00 | |||||||||
| Free cash flow (T + 1) | 1,477 | |||||||||
| Terminal Value | 45,667 | |||||||||
| Present Terminal Value | 33,750 | |||||||||
| Enterprise Value | 39,072 | |||||||||
| Net Debt | -1,083 | |||||||||
| Equity Value | 40,155 | |||||||||
| Diluted Shares Outstanding, MM | 1,086 | |||||||||
| Equity Value Per Share | 36.97 |
Benefits You Will Receive
- Pre-Loaded Financial Model: Access to Chow Tai Seng's actual data for accurate DCF valuation.
- Comprehensive Forecast Control: Modify key variables such as revenue growth, profit margins, WACC, and others.
- Real-Time Calculations: Automatic updates provide immediate feedback as you adjust inputs.
- Professional-Grade Template: A polished Excel file crafted for high-quality valuation purposes.
- Flexible and Reusable: Designed for adaptability, allowing for ongoing use in detailed forecasting.
Key Features
- Comprehensive Historical Data: Chow Tai Seng Jewellery’s past financial reports and pre-populated projections.
- Customizable Parameters: Modify WACC, tax rates, revenue growth, and EBITDA margins as needed.
- Real-Time Insights: Watch the intrinsic value of Chow Tai Seng Jewellery (002867SZ) update instantly.
- Intuitive Visual Displays: Dashboards featuring charts illustrate valuation outcomes and essential metrics.
- Engineered for Precision: A reliable tool designed for analysts, investors, and finance professionals.
How It Functions
- 1. Access the Template: Download and open the Excel file containing Chow Tai Seng Jewellery Co., Ltd.'s preloaded data.
- 2. Modify Assumptions: Adjust key variables such as growth rates, WACC, and capital expenditures.
- 3. Review Results Instantly: The DCF model automatically calculates the intrinsic value and NPV.
- 4. Explore Scenarios: Analyze various forecasts to evaluate different valuation outcomes.
- 5. Utilize with Assurance: Present expert valuation insights to back your decision-making.
Why Opt for Chow Tai Seng's Financial Calculator?
- All-in-One Solution: Offers DCF, WACC, and financial ratio analyses seamlessly integrated.
- Flexible Input Options: Modify the highlighted cells to explore different financial scenarios.
- In-Depth Analysis: Automatically computes the intrinsic value and Net Present Value for Chow Tai Seng (002867SZ).
- Ready-to-Use Data: Comes with historical and projected data for reliable assessments.
- Industry-Grade Quality: Perfect for financial analysts, investors, and business advisors.
Who Would Benefit from This Product?
- Jewelry Students: Discover valuation methods and practice them with real market data.
- Researchers: Integrate industry-standard models into academic projects or studies.
- Investors: Validate your theories and evaluate valuation results for Chow Tai Seng Jewellery (002867SZ).
- Market Analysts: Enhance your efficiency with a customizable DCF model designed for the jewelry sector.
- Small Business Owners: Understand how major jewelry companies like Chow Tai Seng are appraised.
What the Template Includes
- In-Depth DCF Model: An editable template featuring comprehensive valuation calculations.
- Market Data: Chow Tai Seng Jewellery’s historical and projected financials preloaded for your analysis.
- Adjustable Assumptions: Modify WACC, growth rates, and tax variables to explore different scenarios.
- Financial Overview: Complete annual and quarterly financial statements for enhanced analysis.
- Essential Ratios: Integrated analysis focusing on profitability, efficiency, and leverage metrics.
- Interactive Dashboard: Visual outputs including charts and tables for clear and actionable insights.
Disclaimer
All information, articles, and product details provided on this website are for general informational and educational purposes only. We do not claim any ownership over, nor do we intend to infringe upon, any trademarks, copyrights, logos, brand names, or other intellectual property mentioned or depicted on this site. Such intellectual property remains the property of its respective owners, and any references here are made solely for identification or informational purposes, without implying any affiliation, endorsement, or partnership.
We make no representations or warranties, express or implied, regarding the accuracy, completeness, or suitability of any content or products presented. Nothing on this website should be construed as legal, tax, investment, financial, medical, or other professional advice. In addition, no part of this site—including articles or product references—constitutes a solicitation, recommendation, endorsement, advertisement, or offer to buy or sell any securities, franchises, or other financial instruments, particularly in jurisdictions where such activity would be unlawful.
All content is of a general nature and may not address the specific circumstances of any individual or entity. It is not a substitute for professional advice or services. Any actions you take based on the information provided here are strictly at your own risk. You accept full responsibility for any decisions or outcomes arising from your use of this website and agree to release us from any liability in connection with your use of, or reliance upon, the content or products found herein.