
|
Schindler Holding AG (0qot.l) Valoración de DCF |
Completamente Editable: Adáptelo A Sus Necesidades En Excel O Sheets
Diseño Profesional: Plantillas Confiables Y Estándares De La Industria
Predeterminadas Para Un Uso Rápido Y Eficiente
Compatible con MAC / PC, completamente desbloqueado
No Se Necesita Experiencia; Fáciles De Seguir
Schindler Holding AG (0QOT.L) Bundle
¡Simplifique la valoración de Schindler Holding Ag con esta calculadora DCF personalizable! Con el verdadero Schindler que tiene finanzas AG y entradas de pronóstico ajustables, puede probar escenarios y descubrir Schindler que tiene el valor razonable de Ag en minutos.
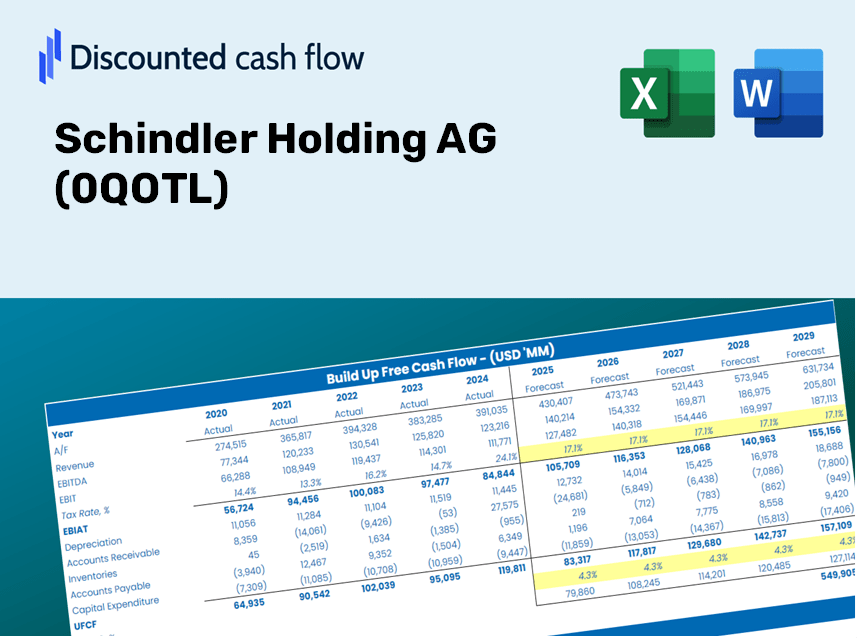
Discounted Cash Flow (DCF) - (USD MM)
| Year | AY1 2020 |
AY2 2021 |
AY3 2022 |
AY4 2023 |
AY5 2024 |
FY1 2025 |
FY2 2026 |
FY3 2027 |
FY4 2028 |
FY5 2029 |
|---|---|---|---|---|---|---|---|---|---|---|
| Revenue | 10,640.0 | 11,236.0 | 11,346.0 | 11,494.0 | 11,236.0 | 11,394.4 | 11,555.1 | 11,718.0 | 11,883.3 | 12,050.8 |
| Revenue Growth, % | 0 | 5.6 | 0.979 | 1.3 | -2.24 | 1.41 | 1.41 | 1.41 | 1.41 | 1.41 |
| EBITDA | 1,389.0 | 1,488.0 | 1,267.0 | 1,579.0 | 1,646.0 | 1,500.7 | 1,521.8 | 1,543.3 | 1,565.1 | 1,587.1 |
| EBITDA, % | 13.05 | 13.24 | 11.17 | 13.74 | 14.65 | 13.17 | 13.17 | 13.17 | 13.17 | 13.17 |
| Depreciation | 348.0 | 339.0 | 344.0 | 349.0 | 330.0 | 348.5 | 353.4 | 358.4 | 363.5 | 368.6 |
| Depreciation, % | 3.27 | 3.02 | 3.03 | 3.04 | 2.94 | 3.06 | 3.06 | 3.06 | 3.06 | 3.06 |
| EBIT | 1,041.0 | 1,149.0 | 923.0 | 1,230.0 | 1,316.0 | 1,152.2 | 1,168.4 | 1,184.9 | 1,201.6 | 1,218.5 |
| EBIT, % | 9.78 | 10.23 | 8.14 | 10.7 | 11.71 | 10.11 | 10.11 | 10.11 | 10.11 | 10.11 |
| Total Cash | 3,391.0 | 3,817.0 | 3,440.0 | 3,573.0 | 4,065.0 | 3,724.3 | 3,776.8 | 3,830.0 | 3,884.0 | 3,938.8 |
| Total Cash, percent | .0 | .0 | .0 | .0 | .0 | .0 | .0 | .0 | .0 | .0 |
| Account Receivables | 2,896.0 | 3,166.0 | 3,146.0 | 2,817.0 | 2,948.0 | 3,050.7 | 3,093.7 | 3,137.4 | 3,181.6 | 3,226.5 |
| Account Receivables, % | 27.22 | 28.18 | 27.73 | 24.51 | 26.24 | 26.77 | 26.77 | 26.77 | 26.77 | 26.77 |
| Inventories | 996.0 | 1,188.0 | 1,418.0 | 1,251.0 | 1,157.0 | 1,221.8 | 1,239.0 | 1,256.5 | 1,274.2 | 1,292.2 |
| Inventories, % | 9.36 | 10.57 | 12.5 | 10.88 | 10.3 | 10.72 | 10.72 | 10.72 | 10.72 | 10.72 |
| Accounts Payable | 783.0 | 928.0 | 957.0 | 928.0 | 1,069.0 | 948.9 | 962.3 | 975.9 | 989.7 | 1,003.6 |
| Accounts Payable, % | 7.36 | 8.26 | 8.43 | 8.07 | 9.51 | 8.33 | 8.33 | 8.33 | 8.33 | 8.33 |
| Capital Expenditure | -141.0 | -132.0 | -130.0 | -102.0 | -109.0 | -125.4 | -127.2 | -129.0 | -130.8 | -132.6 |
| Capital Expenditure, % | -1.33 | -1.17 | -1.15 | -0.88742 | -0.9701 | -1.1 | -1.1 | -1.1 | -1.1 | -1.1 |
| Tax Rate, % | 25.31 | 25.31 | 25.31 | 25.31 | 25.31 | 25.31 | 25.31 | 25.31 | 25.31 | 25.31 |
| EBITAT | 759.2 | 848.7 | 654.7 | 906.5 | 982.9 | 843.6 | 855.5 | 867.6 | 879.8 | 892.2 |
| Depreciation | ||||||||||
| Changes in Account Receivables | ||||||||||
| Changes in Inventories | ||||||||||
| Changes in Accounts Payable | ||||||||||
| Capital Expenditure | ||||||||||
| UFCF | -2,142.8 | 738.7 | 687.7 | 1,620.5 | 1,307.9 | 779.2 | 1,034.9 | 1,049.5 | 1,064.3 | 1,079.3 |
| WACC, % | 7.06 | 7.06 | 7.06 | 7.06 | 7.07 | 7.06 | 7.06 | 7.06 | 7.06 | 7.06 |
| PV UFCF | ||||||||||
| SUM PV UFCF | 4,063.2 | |||||||||
| Long Term Growth Rate, % | 2.00 | |||||||||
| Free cash flow (T + 1) | 1,101 | |||||||||
| Terminal Value | 21,746 | |||||||||
| Present Terminal Value | 15,459 | |||||||||
| Enterprise Value | 19,523 | |||||||||
| Net Debt | -1,787 | |||||||||
| Equity Value | 21,310 | |||||||||
| Diluted Shares Outstanding, MM | 108 | |||||||||
| Equity Value Per Share | 197.87 |
What You Will Receive
- Customizable Excel Template: A fully editable Excel-based DCF Calculator featuring pre-filled real Schindler Holding AG (0QOTL) financials.
- Accurate Data: Historical data and projections (highlighted in yellow cells) for informed decision-making.
- Adjustable Forecasts: Modify key assumptions such as revenue growth, EBITDA margin, and WACC.
- Instant Calculations: Quickly visualize the effect of your inputs on the valuation of Schindler Holding AG (0QOTL).
- Professional Resource: Designed for investors, CFOs, consultants, and financial analysts alike.
- User-Centric Layout: Organized for simplicity and usability, complete with step-by-step guidance.
Key Features
- Customizable Forecast Variables: Adjust essential inputs such as revenue growth, EBITDA %, and capital investments.
- Instant DCF Valuation: Provides immediate calculations of intrinsic value, NPV, and additional financial metrics.
- High-Precision Results: Leverages Schindler Holding AG’s (0QOTL) actual financial data for accurate valuation assessments.
- Streamlined Scenario Analysis: Effortlessly evaluate various assumptions and analyze different outcomes.
- Efficiency Booster: Remove the hassle of constructing intricate valuation models from the ground up.
How It Functions
- 1. Access the Template: Download and open the Excel file containing Schindler Holding AG’s preloaded data.
- 2. Modify Assumptions: Adjust key variables such as growth rates, WACC, and capital expenditures.
- 3. Instant Results: The DCF model automatically calculates intrinsic value and NPV based on your inputs.
- 4. Explore Scenarios: Analyze various forecasts to assess different valuation possibilities.
- 5. Present with Assurance: Share professional valuation insights to reinforce your decision-making process.
Why Choose This Calculator for Schindler Holding AG (0QOTL)?
- All-in-One Solution: Integrates DCF, WACC, and financial ratio analyses for a comprehensive evaluation.
- Flexible Inputs: Modify the yellow-highlighted cells to explore different scenarios.
- In-Depth Analysis: Automatically computes Schindler's intrinsic value and Net Present Value.
- Preloaded Information: Access historical and projected data for reliable benchmarks.
- High-Quality Output: Perfect for financial analysts, investors, and business consultants.
Who Can Benefit from Schindler Holding AG (0QOTL)?
- Investors: Make informed investment choices with a high-quality valuation tool tailored for Schindler Holding AG (0QOTL).
- Financial Analysts: Streamline your workflow with a customizable DCF model specifically designed for Schindler Holding AG (0QOTL).
- Consultants: Effortlessly modify the template for client presentations or analytical reports on Schindler Holding AG (0QOTL).
- Finance Enthusiasts: Enhance your knowledge of valuation methodologies using Schindler Holding AG (0QOTL) as a case study.
- Educators and Students: Utilize it as a hands-on learning resource within finance courses focused on Schindler Holding AG (0QOTL).
Contents of the Template
- Comprehensive DCF Model: An editable template featuring thorough valuation calculations.
- Real-World Data: Schindler Holding AG's historical and projected financials preloaded for your analysis.
- Customizable Parameters: Modify WACC, growth rates, and tax assumptions to explore different scenarios.
- Financial Statements: Complete annual and quarterly breakdowns for in-depth insights.
- Key Ratios: Integrated analysis for profitability, efficiency, and leverage metrics.
- Dashboard with Visual Outputs: Includes charts and tables for clear and actionable insights.
Disclaimer
All information, articles, and product details provided on this website are for general informational and educational purposes only. We do not claim any ownership over, nor do we intend to infringe upon, any trademarks, copyrights, logos, brand names, or other intellectual property mentioned or depicted on this site. Such intellectual property remains the property of its respective owners, and any references here are made solely for identification or informational purposes, without implying any affiliation, endorsement, or partnership.
We make no representations or warranties, express or implied, regarding the accuracy, completeness, or suitability of any content or products presented. Nothing on this website should be construed as legal, tax, investment, financial, medical, or other professional advice. In addition, no part of this site—including articles or product references—constitutes a solicitation, recommendation, endorsement, advertisement, or offer to buy or sell any securities, franchises, or other financial instruments, particularly in jurisdictions where such activity would be unlawful.
All content is of a general nature and may not address the specific circumstances of any individual or entity. It is not a substitute for professional advice or services. Any actions you take based on the information provided here are strictly at your own risk. You accept full responsibility for any decisions or outcomes arising from your use of this website and agree to release us from any liability in connection with your use of, or reliance upon, the content or products found herein.