
|
Zhongyuan Bank Co., Ltd. (1216.HK) Valoración de DCF |
Completamente Editable: Adáptelo A Sus Necesidades En Excel O Sheets
Diseño Profesional: Plantillas Confiables Y Estándares De La Industria
Predeterminadas Para Un Uso Rápido Y Eficiente
Compatible con MAC / PC, completamente desbloqueado
No Se Necesita Experiencia; Fáciles De Seguir
Zhongyuan Bank Co., Ltd. (1216.HK) Bundle
¡Evalúe las perspectivas financieras de Zhongyuan Bank Co., Ltd. como un experto! Esta calculadora DCF (1216HK) proporciona datos financieros precipidos y ofrece la flexibilidad para modificar el crecimiento de los ingresos, WACC, los márgenes y otros supuestos esenciales para alinearse con sus proyecciones.
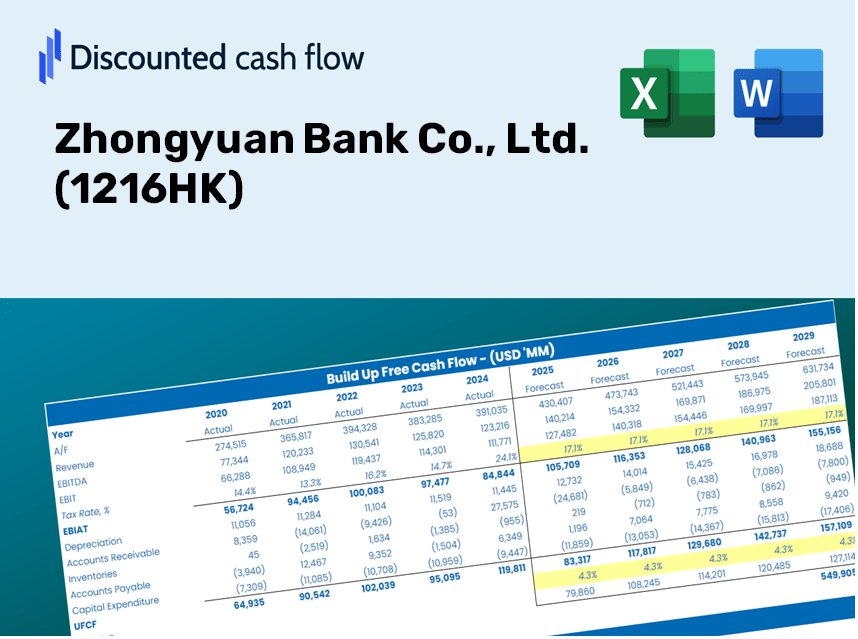
Discounted Cash Flow (DCF) - (USD MM)
| Year | AY1 2020 |
AY2 2021 |
AY3 2022 |
AY4 2023 |
AY5 2024 |
FY1 2025 |
FY2 2026 |
FY3 2027 |
FY4 2028 |
FY5 2029 |
|---|---|---|---|---|---|---|---|---|---|---|
| Revenue | 12,650.7 | 12,720.0 | 15,756.2 | 14,884.3 | 20,488.1 | 23,383.7 | 26,688.6 | 30,460.5 | 34,765.5 | 39,679.0 |
| Revenue Growth, % | 0 | 0.548 | 23.87 | -5.53 | 37.65 | 14.13 | 14.13 | 14.13 | 14.13 | 14.13 |
| EBITDA | .0 | 6,094.9 | 6,269.0 | .0 | 4,668.7 | 5,167.4 | 5,897.7 | 6,731.2 | 7,682.5 | 8,768.3 |
| EBITDA, % | 0 | 47.92 | 39.79 | 0 | 22.79 | 22.1 | 22.1 | 22.1 | 22.1 | 22.1 |
| Depreciation | 1,151.3 | 1,071.0 | 1,562.6 | 1,861.9 | 1,663.7 | 2,248.0 | 2,565.7 | 2,928.3 | 3,342.1 | 3,814.5 |
| Depreciation, % | 9.1 | 8.42 | 9.92 | 12.51 | 8.12 | 9.61 | 9.61 | 9.61 | 9.61 | 9.61 |
| EBIT | -1,151.3 | 5,023.9 | 4,706.4 | -1,861.9 | 3,005.0 | 2,919.4 | 3,332.0 | 3,802.9 | 4,340.4 | 4,953.8 |
| EBIT, % | -9.1 | 39.5 | 29.87 | -12.51 | 14.67 | 12.48 | 12.48 | 12.48 | 12.48 | 12.48 |
| Total Cash | 113,726.6 | 118,734.7 | 141,498.6 | 49,074.4 | 43,524.0 | 23,383.7 | 26,688.6 | 30,460.5 | 34,765.5 | 39,679.0 |
| Total Cash, percent | .0 | .0 | .0 | .0 | .0 | .0 | .0 | .0 | .0 | .0 |
| Account Receivables | 6,002.9 | 5,961.5 | 87,680.6 | 62,037.3 | 51,378.4 | 18,441.2 | 21,047.6 | 24,022.2 | 27,417.3 | 31,292.3 |
| Account Receivables, % | 47.45 | 46.87 | 556.48 | 416.8 | 250.77 | 78.86 | 78.86 | 78.86 | 78.86 | 78.86 |
| Inventories | .0 | .0 | .0 | .0 | .0 | .0 | .0 | .0 | .0 | .0 |
| Inventories, % | 0 | 0 | 0 | 0 | 0 | 0 | 0 | 0 | 0 | 0 |
| Accounts Payable | 6,948.1 | 7,940.2 | 19,597.1 | 24,322.3 | 24,435.2 | 19,518.1 | 22,276.7 | 25,425.1 | 29,018.4 | 33,119.6 |
| Accounts Payable, % | 54.92 | 62.42 | 124.38 | 163.41 | 119.27 | 83.47 | 83.47 | 83.47 | 83.47 | 83.47 |
| Capital Expenditure | -929.9 | -680.2 | -1,064.9 | -921.1 | -1,719.2 | -1,591.8 | -1,816.8 | -2,073.5 | -2,366.6 | -2,701.0 |
| Capital Expenditure, % | -7.35 | -5.35 | -6.76 | -6.19 | -8.39 | -6.81 | -6.81 | -6.81 | -6.81 | -6.81 |
| Tax Rate, % | -25.28 | -25.28 | -25.28 | -25.28 | -25.28 | -25.28 | -25.28 | -25.28 | -25.28 | -25.28 |
| EBITAT | -854.2 | 3,894.9 | 3,103.9 | -2,028.0 | 3,764.8 | 2,438.7 | 2,783.4 | 3,176.7 | 3,625.7 | 4,138.1 |
| Depreciation | ||||||||||
| Changes in Account Receivables | ||||||||||
| Changes in Inventories | ||||||||||
| Changes in Accounts Payable | ||||||||||
| Capital Expenditure | ||||||||||
| UFCF | 312.4 | 5,319.2 | -66,460.4 | 29,281.3 | 14,481.0 | 31,115.0 | 3,684.5 | 4,205.2 | 4,799.5 | 5,477.9 |
| WACC, % | 84.71 | 88.42 | 75.52 | 113.47 | 113.47 | 95.12 | 95.12 | 95.12 | 95.12 | 95.12 |
| PV UFCF | ||||||||||
| SUM PV UFCF | 18,005.6 | |||||||||
| Long Term Growth Rate, % | 2.00 | |||||||||
| Free cash flow (T + 1) | 5,587 | |||||||||
| Terminal Value | 6,000 | |||||||||
| Present Terminal Value | 212 | |||||||||
| Enterprise Value | 18,218 | |||||||||
| Net Debt | -28,857 | |||||||||
| Equity Value | 47,075 | |||||||||
| Diluted Shares Outstanding, MM | 36,550 | |||||||||
| Equity Value Per Share | 1.29 |
Benefits You Will Receive
- Customizable Excel Template: An editable DCF Calculator in Excel featuring pre-loaded financials for Zhongyuan Bank Co., Ltd. (1216HK).
- Accurate Data: Access to historical performance data and future projections (highlighted in the yellow cells).
- Adaptive Forecasting: Modify key assumptions such as revenue growth, EBITDA margin, and WACC.
- Instant Calculations: Quickly observe how your inputs affect Zhongyuan Bank's valuation.
- Professional Resource: Designed for investors, CFOs, consultants, and financial analysts.
- Intuitive Interface: Organized for straightforward navigation, featuring comprehensive step-by-step guidance.
Key Features
- Customizable Financial Parameters: Adjust essential inputs such as revenue growth, net profit margin, and capital investments.
- Instant DCF Valuation: Quickly computes intrinsic value, net present value, and other key metrics.
- High-Precision Accuracy: Based on Zhongyuan Bank's real financial data for reliable valuation results.
- Simplified Scenario Analysis: Easily explore various assumptions and evaluate different outcomes.
- Efficiency Booster: Avoid the hassle of constructing intricate valuation models from the ground up.
How It Works
- Step 1: Download the ready-to-use Excel template featuring Zhongyuan Bank Co., Ltd.'s (1216HK) data.
- Step 2: Review the populated sheets to familiarize yourself with the essential metrics.
- Step 3: Adjust forecasts and assumptions in the editable yellow cells (WACC, growth rates, profit margins).
- Step 4: View the updated calculations instantly, including Zhongyuan Bank Co., Ltd.'s (1216HK) intrinsic value.
- Step 5: Utilize the results to make well-informed investment decisions or create detailed reports.
Why Choose Zhongyuan Bank's Calculator?
- Time-Saving: Skip the hassle of building a DCF model from scratch – it’s ready for immediate use.
- Enhanced Accuracy: Dependable financial data and formulas minimize valuation errors.
- Completely Customizable: Adjust the model to align with your specific assumptions and forecasts.
- User-Friendly: Intuitive charts and outputs facilitate straightforward result analysis.
- Endorsed by Professionals: Crafted for experts who prioritize accuracy and functionality.
Who Can Benefit from This Product?
- Investors: Evaluate Zhongyuan Bank Co., Ltd.'s (1216HK) valuation prior to making stock trades.
- CFOs and Financial Analysts: Enhance valuation workflows and assess financial forecasts.
- Startup Founders: Understand the valuation methods used for significant companies like Zhongyuan Bank Co., Ltd. (1216HK).
- Consultants: Create detailed valuation reports for your clients focused on Zhongyuan Bank Co., Ltd. (1216HK).
- Students and Educators: Utilize real-time data to practice and instruct on valuation strategies.
Contents of the Template
- Preloaded 1216HK Data: Historical and projected financial metrics, including revenue, EBIT, and capital expenditures.
- DCF and WACC Models: Advanced sheets for determining intrinsic value and Weighted Average Cost of Capital.
- Editable Inputs: Cells highlighted in yellow for customizing revenue growth, tax rates, and discount rates.
- Financial Statements: Detailed annual and quarterly financials for in-depth analysis.
- Key Ratios: Ratios for profitability, leverage, and efficiency to assess performance.
- Dashboard and Charts: Visual presentations of valuation results and underlying assumptions.
Disclaimer
All information, articles, and product details provided on this website are for general informational and educational purposes only. We do not claim any ownership over, nor do we intend to infringe upon, any trademarks, copyrights, logos, brand names, or other intellectual property mentioned or depicted on this site. Such intellectual property remains the property of its respective owners, and any references here are made solely for identification or informational purposes, without implying any affiliation, endorsement, or partnership.
We make no representations or warranties, express or implied, regarding the accuracy, completeness, or suitability of any content or products presented. Nothing on this website should be construed as legal, tax, investment, financial, medical, or other professional advice. In addition, no part of this site—including articles or product references—constitutes a solicitation, recommendation, endorsement, advertisement, or offer to buy or sell any securities, franchises, or other financial instruments, particularly in jurisdictions where such activity would be unlawful.
All content is of a general nature and may not address the specific circumstances of any individual or entity. It is not a substitute for professional advice or services. Any actions you take based on the information provided here are strictly at your own risk. You accept full responsibility for any decisions or outcomes arising from your use of this website and agree to release us from any liability in connection with your use of, or reliance upon, the content or products found herein.