
|
Postal Savings Bank of China Co., Ltd. (1658.HK) Valoración de DCF |
Completamente Editable: Adáptelo A Sus Necesidades En Excel O Sheets
Diseño Profesional: Plantillas Confiables Y Estándares De La Industria
Predeterminadas Para Un Uso Rápido Y Eficiente
Compatible con MAC / PC, completamente desbloqueado
No Se Necesita Experiencia; Fáciles De Seguir
Postal Savings Bank of China Co., Ltd. (1658.HK) Bundle
¡Explore las perspectivas financieras del Postal Savings Bank of China Co., Ltd. (1658HK) con nuestra calculadora DCF fácil de usar! Ingrese sus suposiciones con respecto al crecimiento, los márgenes y los gastos para calcular el valor intrínseco del Postal Savings Bank of China Co., Ltd. (1658HK) y mejorar su estrategia de inversión.
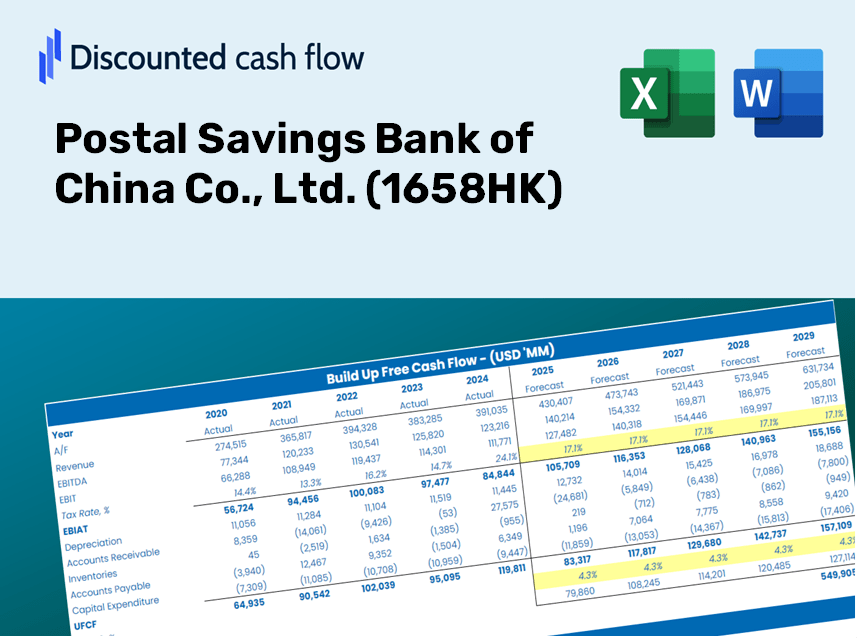
Discounted Cash Flow (DCF) - (USD MM)
| Year | AY1 2020 |
AY2 2021 |
AY3 2022 |
AY4 2023 |
AY5 2024 |
FY1 2025 |
FY2 2026 |
FY3 2027 |
FY4 2028 |
FY5 2029 |
|---|---|---|---|---|---|---|---|---|---|---|
| Revenue | 258,754.1 | 436,800.4 | 477,014.0 | 347,079.8 | 351,424.5 | 397,134.4 | 448,789.9 | 507,164.2 | 573,131.3 | 647,678.7 |
| Revenue Growth, % | 0 | 68.81 | 9.21 | -27.24 | 1.25 | 13.01 | 13.01 | 13.01 | 13.01 | 13.01 |
| EBITDA | .0 | 99,157.4 | 112,620.0 | .0 | .0 | 36,782.8 | 41,567.1 | 46,973.8 | 53,083.7 | 59,988.3 |
| EBITDA, % | 0 | 22.7 | 23.61 | 0 | 0 | 9.26 | 9.26 | 9.26 | 9.26 | 9.26 |
| Depreciation | 8,851.6 | 9,902.5 | 12,506.0 | 13,290.6 | 12,476.4 | 12,461.4 | 14,082.3 | 15,914.0 | 17,983.9 | 20,323.1 |
| Depreciation, % | 3.42 | 2.27 | 2.62 | 3.83 | 3.55 | 3.14 | 3.14 | 3.14 | 3.14 | 3.14 |
| EBIT | -8,851.6 | 89,254.9 | 100,114.0 | -13,290.6 | -12,476.4 | 24,321.3 | 27,484.8 | 31,059.8 | 35,099.8 | 39,665.2 |
| EBIT, % | -3.42 | 20.43 | 20.99 | -3.83 | -3.55 | 6.12 | 6.12 | 6.12 | 6.12 | 6.12 |
| Total Cash | 1,656,739.0 | 1,714,132.1 | 1,898,147.1 | 2,009,578.1 | 2,148,352.0 | 397,134.4 | 448,789.9 | 507,164.2 | 573,131.3 | 647,678.7 |
| Total Cash, percent | .0 | .0 | .0 | .0 | .0 | .0 | .0 | .0 | .0 | .0 |
| Account Receivables | 19,709.6 | 38,247.9 | 137,986.0 | 521,507.8 | 554,505.8 | 194,834.6 | 220,176.8 | 248,815.3 | 281,178.8 | 317,751.9 |
| Account Receivables, % | 7.62 | 8.76 | 28.93 | 150.26 | 157.79 | 49.06 | 49.06 | 49.06 | 49.06 | 49.06 |
| Inventories | .0 | .0 | .0 | .0 | .0 | .0 | .0 | .0 | .0 | .0 |
| Inventories, % | 0 | 0 | 0 | 0 | 0 | 0 | 0 | 0 | 0 | 0 |
| Accounts Payable | .0 | .0 | .0 | .0 | .0 | .0 | .0 | .0 | .0 | .0 |
| Accounts Payable, % | 0 | 0 | 0 | 0 | 0 | 0 | 0 | 0 | 0 | 0 |
| Capital Expenditure | -8,296.1 | -15,179.7 | -13,589.7 | -14,204.5 | -22,298.9 | -15,860.1 | -17,923.0 | -20,254.3 | -22,888.7 | -25,865.9 |
| Capital Expenditure, % | -3.21 | -3.48 | -2.85 | -4.09 | -6.35 | -3.99 | -3.99 | -3.99 | -3.99 | -3.99 |
| Tax Rate, % | 8.58 | 8.58 | 8.58 | 8.58 | 8.58 | 8.58 | 8.58 | 8.58 | 8.58 | 8.58 |
| EBITAT | -8,340.2 | 83,464.8 | 93,385.9 | -12,517.4 | -11,406.4 | 22,697.6 | 25,649.9 | 28,986.2 | 32,756.5 | 37,017.1 |
| Depreciation | ||||||||||
| Changes in Account Receivables | ||||||||||
| Changes in Inventories | ||||||||||
| Changes in Accounts Payable | ||||||||||
| Capital Expenditure | ||||||||||
| UFCF | -27,494.2 | 59,649.4 | -7,435.9 | -396,953.1 | -54,226.9 | 378,970.2 | -3,533.0 | -3,992.6 | -4,511.9 | -5,098.7 |
| WACC, % | 37.25 | 37 | 36.92 | 37.23 | 36.28 | 36.94 | 36.94 | 36.94 | 36.94 | 36.94 |
| PV UFCF | ||||||||||
| SUM PV UFCF | 270,968.0 | |||||||||
| Long Term Growth Rate, % | 2.00 | |||||||||
| Free cash flow (T + 1) | -5,201 | |||||||||
| Terminal Value | -14,886 | |||||||||
| Present Terminal Value | -3,092 | |||||||||
| Enterprise Value | 267,876 | |||||||||
| Net Debt | -2,002,081 | |||||||||
| Equity Value | 2,269,957 | |||||||||
| Diluted Shares Outstanding, MM | 99,161 | |||||||||
| Equity Value Per Share | 22.89 |
Benefits You Will Receive
- Genuine PSBC Financials: Access historical and projected data for precise valuations.
- Customizable Variables: Adjust key metrics such as WACC, tax rates, revenue growth, and capital expenses.
- Real-Time Calculations: Intrinsic value and NPV are automatically computed.
- Scenario Analysis: Explore various scenarios to assess the future outlook of Postal Savings Bank of China (1658HK).
- User-Friendly and Professional Design: Crafted for industry experts but easy to navigate for newcomers.
Key Features
- Real-World PSBC Data: Pre-loaded with the historical financial performance and future projections of Postal Savings Bank of China Co., Ltd. (1658HK).
- Completely Customizable Inputs: Tweak revenue growth rates, profit margins, weighted average cost of capital (WACC), tax rates, and capital investment figures.
- Dynamic Valuation Model: Automatically updates Net Present Value (NPV) and intrinsic value based on user-defined inputs.
- Scenario Analysis: Develop various forecasting scenarios to explore different valuation possibilities.
- Intuitive Design: User-friendly interface crafted for both professionals and newcomers.
How It Works
- Step 1: Download the Excel file for Postal Savings Bank of China Co., Ltd. (1658HK).
- Step 2: Examine the pre-filled financial data and forecasts specific to the bank.
- Step 3: Adjust key inputs such as revenue growth, WACC, and tax rates (highlighted cells for easy identification).
- Step 4: Observe the DCF model refresh in real-time as you modify your assumptions.
- Step 5: Evaluate the outputs and leverage the insights for informed investment choices.
Why Opt for the Postal Savings Bank of China Calculator?
- Time-Efficient: Skip the hassle of building a DCF model from the ground up – our tool is ready for immediate use.
- Enhanced Accuracy: Access to dependable financial data and calculations minimizes valuation errors.
- Completely Customizable: Adjust the model to align with your specific assumptions and forecasts.
- Simple to Understand: Intuitive charts and outputs facilitate straightforward analysis of the results.
- Trusted by Professionals: Crafted for experts who prioritize precision and ease of use.
Who Can Benefit from Postal Savings Bank of China Co., Ltd. (1658HK)?
- Investors: Gain the confidence to make informed decisions with reliable insights from a leading banking institution.
- Financial Analysts: Streamline your analysis by leveraging our robust financial data and reports customized for your needs.
- Consultants: Efficiently modify our resources for impactful presentations or detailed client reports.
- Finance Enthusiasts: Enhance your knowledge of banking and finance concepts through practical examples and case studies.
- Educators and Students: Utilize our materials as a hands-on tool for learning in finance and banking courses.
Contents of the Template
- Pre-Filled Data: Contains Postal Savings Bank of China Co., Ltd.'s historical financial performance and future forecasts.
- Discounted Cash Flow Model: An editable DCF valuation model featuring automated calculations.
- Weighted Average Cost of Capital (WACC): A specialized sheet for computing WACC using custom inputs.
- Key Financial Ratios: Evaluate the profitability, efficiency, and leverage of Postal Savings Bank of China Co., Ltd.
- Customizable Inputs: Effortlessly modify revenue growth, profit margins, and tax rates.
- Clear Dashboard: Visual representations and tables summarizing essential valuation outcomes.
Disclaimer
All information, articles, and product details provided on this website are for general informational and educational purposes only. We do not claim any ownership over, nor do we intend to infringe upon, any trademarks, copyrights, logos, brand names, or other intellectual property mentioned or depicted on this site. Such intellectual property remains the property of its respective owners, and any references here are made solely for identification or informational purposes, without implying any affiliation, endorsement, or partnership.
We make no representations or warranties, express or implied, regarding the accuracy, completeness, or suitability of any content or products presented. Nothing on this website should be construed as legal, tax, investment, financial, medical, or other professional advice. In addition, no part of this site—including articles or product references—constitutes a solicitation, recommendation, endorsement, advertisement, or offer to buy or sell any securities, franchises, or other financial instruments, particularly in jurisdictions where such activity would be unlawful.
All content is of a general nature and may not address the specific circumstances of any individual or entity. It is not a substitute for professional advice or services. Any actions you take based on the information provided here are strictly at your own risk. You accept full responsibility for any decisions or outcomes arising from your use of this website and agree to release us from any liability in connection with your use of, or reliance upon, the content or products found herein.