
|
House Foods Group Inc. (2810.T) Valoración de DCF |
Completamente Editable: Adáptelo A Sus Necesidades En Excel O Sheets
Diseño Profesional: Plantillas Confiables Y Estándares De La Industria
Predeterminadas Para Un Uso Rápido Y Eficiente
Compatible con MAC / PC, completamente desbloqueado
No Se Necesita Experiencia; Fáciles De Seguir
House Foods Group Inc. (2810.T) Bundle
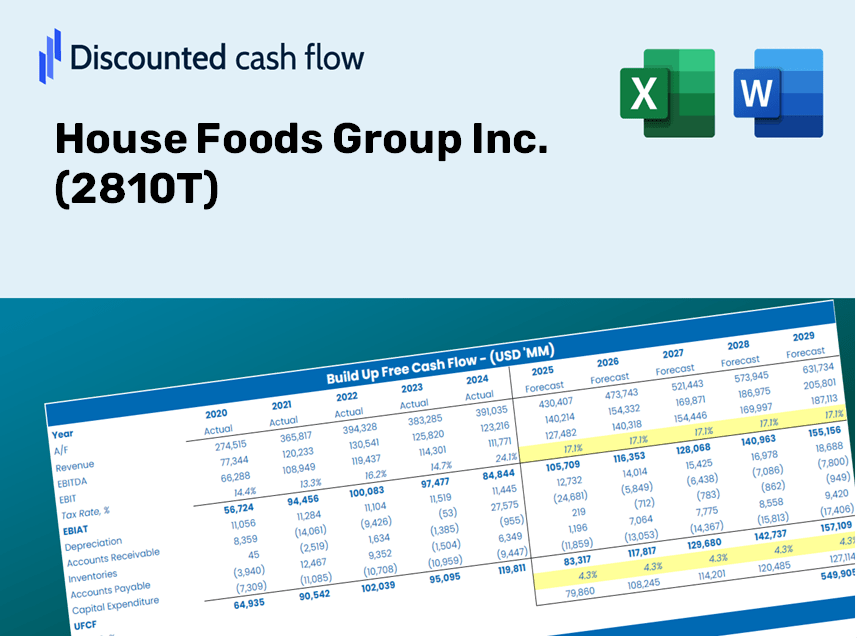
Diseñada para la precisión, nuestra calculadora DCF de House Foods Group Inc. (2810T) le permite evaluar la valoración de la Compañía utilizando datos financieros del mundo real, al tiempo que proporciona la flexibilidad para modificar todos los parámetros esenciales para mejorar las proyecciones.
Benefits You Will Receive
- Flexible Forecast Inputs: Effortlessly adjust parameters (growth %, margins, WACC) to explore various scenarios.
- Comprehensive Data: House Foods Group Inc.'s (2810T) financial information pre-loaded to enhance your analysis.
- Automated DCF Calculations: The template computes Net Present Value (NPV) and intrinsic value automatically.
- Customizable and Sleek: A refined Excel model tailored to meet your valuation requirements.
- Designed for Analysts and Investors: Perfect for evaluating projections, confirming strategies, and optimizing your time.
Key Features
- Accurate Financial Data for House Foods Group: Gain access to reliable historical figures and future forecasts.
- Customizable Assumptions: Modify highlighted cells, including WACC, growth rates, and profit margins.
- Real-Time Calculations: Automatic recalculations for DCF, Net Present Value (NPV), and cash flow insights.
- User-Friendly Dashboard: Easy-to-understand charts and summaries to help you visualize valuation outcomes.
- Designed for All Skill Levels: A straightforward and intuitive interface suitable for investors, CFOs, and consultants alike.
How It Functions
- Download the Template: Gain immediate access to the Excel-based House Foods Group Inc. DCF Calculator.
- Input Your Assumptions: Modify the yellow-highlighted cells for growth rates, WACC, profit margins, and additional parameters.
- Instant Calculations: The model automatically computes the intrinsic value of House Foods Group Inc. (2810T).
- Test Scenarios: Explore various assumptions to assess potential changes in valuation.
- Analyze and Decide: Utilize the results to inform your investment strategies or financial assessments.
Why Choose This Calculator for House Foods Group Inc. (2810T)?
- Reliable Data: Up-to-date House Foods financials provide trustworthy valuation metrics.
- Tailorable: Modify essential factors like growth forecasts, WACC, and tax rates to suit your analysis.
- Efficient: Pre-configured calculations save you the hassle of starting from ground zero.
- Professional-Quality Tool: Crafted for investors, analysts, and consultants in the food industry.
- Easy to Use: User-friendly design and guided instructions make it accessible for everyone.
Who Can Benefit from This Product?
- Individual Investors: Gain insights for making informed decisions regarding the purchase or sale of House Foods Group Inc. (2810T) stock.
- Financial Analysts: Enhance your valuation processes with comprehensive financial models tailored for House Foods Group Inc. (2810T).
- Consultants: Provide clients with accurate and timely valuation analysis related to House Foods Group Inc. (2810T).
- Business Owners: Learn how large corporations like House Foods Group Inc. (2810T) are valued to inform your own business strategy.
- Finance Students: Acquire practical knowledge of valuation methods using real data and case studies focused on House Foods Group Inc. (2810T).
Contents of the Template
- Pre-Filled DCF Model: House Foods Group Inc.’s financial data preloaded for immediate application.
- WACC Calculator: Comprehensive calculations for the Weighted Average Cost of Capital.
- Financial Ratios: Assess House Foods Group Inc.'s profitability, leverage, and efficiency.
- Editable Inputs: Modify assumptions such as growth rates, margins, and CAPEX to suit your analyses.
- Financial Statements: Access annual and quarterly reports for in-depth examination.
- Interactive Dashboard: Effortlessly visualize essential valuation metrics and outcomes.
Disclaimer
All information, articles, and product details provided on this website are for general informational and educational purposes only. We do not claim any ownership over, nor do we intend to infringe upon, any trademarks, copyrights, logos, brand names, or other intellectual property mentioned or depicted on this site. Such intellectual property remains the property of its respective owners, and any references here are made solely for identification or informational purposes, without implying any affiliation, endorsement, or partnership.
We make no representations or warranties, express or implied, regarding the accuracy, completeness, or suitability of any content or products presented. Nothing on this website should be construed as legal, tax, investment, financial, medical, or other professional advice. In addition, no part of this site—including articles or product references—constitutes a solicitation, recommendation, endorsement, advertisement, or offer to buy or sell any securities, franchises, or other financial instruments, particularly in jurisdictions where such activity would be unlawful.
All content is of a general nature and may not address the specific circumstances of any individual or entity. It is not a substitute for professional advice or services. Any actions you take based on the information provided here are strictly at your own risk. You accept full responsibility for any decisions or outcomes arising from your use of this website and agree to release us from any liability in connection with your use of, or reliance upon, the content or products found herein.