
|
Ariake Japan Co., Ltd. (2815.T) Valoración de DCF |
Completamente Editable: Adáptelo A Sus Necesidades En Excel O Sheets
Diseño Profesional: Plantillas Confiables Y Estándares De La Industria
Predeterminadas Para Un Uso Rápido Y Eficiente
Compatible con MAC / PC, completamente desbloqueado
No Se Necesita Experiencia; Fáciles De Seguir
ARIAKE JAPAN Co., Ltd. (2815.T) Bundle
¿Busca evaluar el valor intrínseco de Ariake Japan Co., Ltd.? Nuestra calculadora DCF (2815T) integra datos del mundo real con características integrales de personalización, lo que le permite refinar los pronósticos y mejorar sus estrategias de inversión.
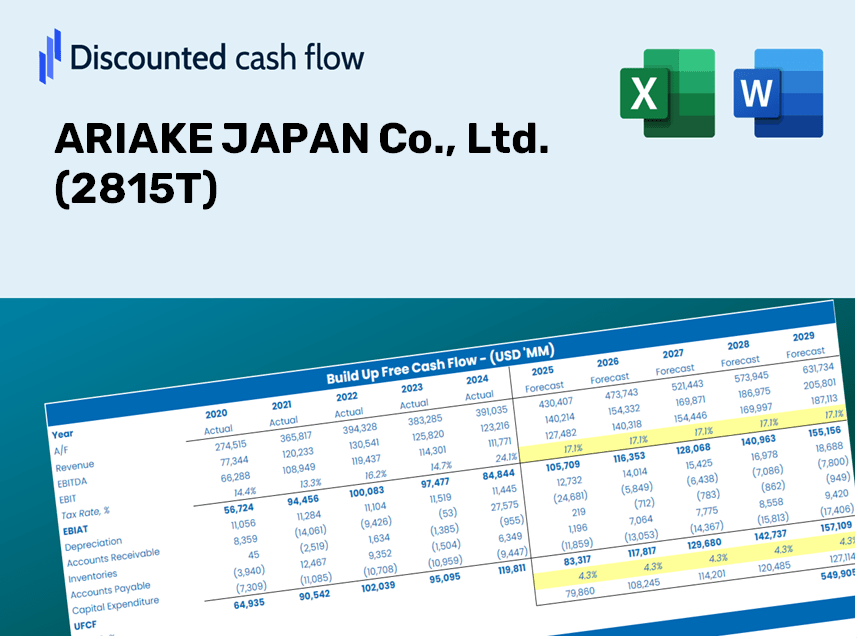
Discounted Cash Flow (DCF) - (USD MM)
| Year | AY1 2021 |
AY2 2022 |
AY3 2023 |
AY4 2024 |
AY5 2025 |
FY1 2026 |
FY2 2027 |
FY3 2028 |
FY4 2029 |
FY5 2030 |
|---|---|---|---|---|---|---|---|---|---|---|
| Revenue | 49,684.5 | 52,658.6 | 55,698.3 | 59,981.5 | 65,400.9 | 70,058.0 | 75,046.8 | 80,390.7 | 86,115.3 | 92,247.5 |
| Revenue Growth, % | 0 | 5.99 | 5.77 | 7.69 | 9.04 | 7.12 | 7.12 | 7.12 | 7.12 | 7.12 |
| EBITDA | 12,171.0 | 12,992.9 | 11,204.0 | 12,854.1 | 14,245.6 | 15,762.8 | 16,885.2 | 18,087.6 | 19,375.6 | 20,755.3 |
| EBITDA, % | 24.5 | 24.67 | 20.12 | 21.43 | 21.78 | 22.5 | 22.5 | 22.5 | 22.5 | 22.5 |
| Depreciation | 1,600.2 | 1,832.9 | 1,890.0 | 2,039.0 | 2,145.3 | 2,350.4 | 2,517.7 | 2,697.0 | 2,889.1 | 3,094.8 |
| Depreciation, % | 3.22 | 3.48 | 3.39 | 3.4 | 3.28 | 3.35 | 3.35 | 3.35 | 3.35 | 3.35 |
| EBIT | 10,570.9 | 11,160.0 | 9,314.0 | 10,815.1 | 12,100.3 | 13,412.4 | 14,367.5 | 15,390.6 | 16,486.6 | 17,660.6 |
| EBIT, % | 21.28 | 21.19 | 16.72 | 18.03 | 18.5 | 19.14 | 19.14 | 19.14 | 19.14 | 19.14 |
| Total Cash | 60,377.8 | 64,904.5 | 56,796.8 | 50,205.3 | 58,958.9 | 66,394.2 | 71,122.0 | 76,186.5 | 81,611.7 | 87,423.1 |
| Total Cash, percent | .0 | .0 | .0 | .0 | .0 | .0 | .0 | .0 | .0 | .0 |
| Account Receivables | 10,362.0 | 11,224.0 | 12,121.0 | 13,519.1 | 12,815.6 | 14,861.6 | 15,919.9 | 17,053.5 | 18,267.9 | 19,568.7 |
| Account Receivables, % | 20.86 | 21.31 | 21.76 | 22.54 | 19.6 | 21.21 | 21.21 | 21.21 | 21.21 | 21.21 |
| Inventories | 7,891.9 | 9,359.8 | 11,625.5 | 11,714.0 | 11,689.3 | 12,881.4 | 13,798.6 | 14,781.2 | 15,833.8 | 16,961.3 |
| Inventories, % | 15.88 | 17.77 | 20.87 | 19.53 | 17.87 | 18.39 | 18.39 | 18.39 | 18.39 | 18.39 |
| Accounts Payable | 4,451.4 | 4,546.1 | 5,010.2 | 4,871.1 | 4,770.1 | 5,885.2 | 6,304.3 | 6,753.2 | 7,234.1 | 7,749.2 |
| Accounts Payable, % | 8.96 | 8.63 | 9 | 8.12 | 7.29 | 8.4 | 8.4 | 8.4 | 8.4 | 8.4 |
| Capital Expenditure | -1,516.7 | -2,371.5 | -3,026.4 | -3,046.3 | -964.6 | -2,738.3 | -2,933.3 | -3,142.2 | -3,366.0 | -3,605.7 |
| Capital Expenditure, % | -3.05 | -4.5 | -5.43 | -5.08 | -1.47 | -3.91 | -3.91 | -3.91 | -3.91 | -3.91 |
| Tax Rate, % | 32.18 | 32.18 | 32.18 | 32.18 | 32.18 | 32.18 | 32.18 | 32.18 | 32.18 | 32.18 |
| EBITAT | 7,279.4 | 7,713.1 | 6,388.5 | 7,353.2 | 8,206.4 | 9,184.2 | 9,838.2 | 10,538.8 | 11,289.2 | 12,093.1 |
| Depreciation | ||||||||||
| Changes in Account Receivables | ||||||||||
| Changes in Inventories | ||||||||||
| Changes in Accounts Payable | ||||||||||
| Capital Expenditure | ||||||||||
| UFCF | -6,439.6 | 4,939.2 | 2,553.5 | 4,720.3 | 10,014.3 | 6,673.3 | 7,866.1 | 8,426.3 | 9,026.3 | 9,669.0 |
| WACC, % | 4.68 | 4.68 | 4.68 | 4.68 | 4.68 | 4.68 | 4.68 | 4.68 | 4.68 | 4.68 |
| PV UFCF | ||||||||||
| SUM PV UFCF | 36,104.9 | |||||||||
| Long Term Growth Rate, % | 2.00 | |||||||||
| Free cash flow (T + 1) | 9,862 | |||||||||
| Terminal Value | 367,483 | |||||||||
| Present Terminal Value | 292,308 | |||||||||
| Enterprise Value | 328,413 | |||||||||
| Net Debt | -58,941 | |||||||||
| Equity Value | 387,353 | |||||||||
| Diluted Shares Outstanding, MM | 32 | |||||||||
| Equity Value Per Share | 12,162.38 |
What You Will Receive
- Flexible Forecast Inputs: Effortlessly modify key assumptions (growth %, margins, WACC) to explore various scenarios.
- Actual Market Data: Pre-filled financial information for ARIAKE JAPAN Co., Ltd. (2815T) to kickstart your analysis.
- Automatic DCF Calculations: The template computes the Net Present Value (NPV) and intrinsic value for you.
- Customizable and Professional Design: A sleek Excel model tailored to meet your valuation requirements.
- Designed for Analysts and Investors: Perfect for assessing projections, validating strategies, and optimizing efficiency.
Key Features
- 🔍 Real-Life ARIAKE JAPAN Financials: Pre-filled historical and projected data for ARIAKE JAPAN Co., Ltd. (2815T).
- ✏️ Fully Customizable Inputs: Modify all essential parameters (yellow cells) such as WACC, growth %, and tax rates.
- 📊 Professional DCF Valuation: Integrated formulas determine ARIAKE JAPAN's intrinsic value utilizing the Discounted Cash Flow method.
- ⚡ Instant Results: View ARIAKE JAPAN's valuation immediately after adjustments.
- Scenario Analysis: Experiment and compare results for different financial assumptions side by side.
How It Works
- Step 1: Download the Excel file.
- Step 2: Review the pre-filled data for ARIAKE JAPAN Co., Ltd. (2815T) (historical and projected).
- Step 3: Modify key assumptions (yellow cells) based on your analysis.
- Step 4: Observe automatic recalculations of ARIAKE JAPAN's intrinsic value.
- Step 5: Utilize the results for investment decisions or reporting.
Why Opt for ARIAKE JAPAN Co., Ltd. (2815T) Calculator?
- Precision: Utilizes authentic ARIAKE financial data to ensure accuracy.
- Adaptability: Built for users to easily experiment with and adjust inputs.
- Efficiency: Avoid the complexity of constructing a financial model from the ground up.
- Expert-Quality: Crafted with insights and usability that meet CFO standards.
- Intuitive Design: Simple to navigate, even for those with limited financial modeling skills.
Who Can Benefit from ARIAKE JAPAN Co., Ltd. ([2815T])?
- Food Industry Students: Discover key analysis techniques and apply them to real-world data.
- Researchers: Integrate industry standards and professional models into your academic work.
- Investors: Validate your investment assumptions and evaluate the market performance of ARIAKE JAPAN Co., Ltd. ([2815T]).
- Market Analysts: Enhance your analysis process with a flexible, ready-to-use financial model.
- Entrepreneurs: Learn how major players like ARIAKE JAPAN Co., Ltd. ([2815T]) are assessed within the industry.
What the Template Includes
- Comprehensive DCF Model: Fully editable template featuring in-depth valuation calculations.
- Real-World Data: ARIAKE JAPAN’s historical and projected financials preloaded for your analysis.
- Customizable Parameters: Modify WACC, growth rates, and tax assumptions to explore various scenarios.
- Financial Statements: Complete annual and quarterly breakdowns for enhanced insights.
- Key Ratios: Integrated analysis covering profitability, efficiency, and leverage metrics.
- Dashboard with Visual Outputs: Charts and tables that provide clear and actionable results.
Disclaimer
All information, articles, and product details provided on this website are for general informational and educational purposes only. We do not claim any ownership over, nor do we intend to infringe upon, any trademarks, copyrights, logos, brand names, or other intellectual property mentioned or depicted on this site. Such intellectual property remains the property of its respective owners, and any references here are made solely for identification or informational purposes, without implying any affiliation, endorsement, or partnership.
We make no representations or warranties, express or implied, regarding the accuracy, completeness, or suitability of any content or products presented. Nothing on this website should be construed as legal, tax, investment, financial, medical, or other professional advice. In addition, no part of this site—including articles or product references—constitutes a solicitation, recommendation, endorsement, advertisement, or offer to buy or sell any securities, franchises, or other financial instruments, particularly in jurisdictions where such activity would be unlawful.
All content is of a general nature and may not address the specific circumstances of any individual or entity. It is not a substitute for professional advice or services. Any actions you take based on the information provided here are strictly at your own risk. You accept full responsibility for any decisions or outcomes arising from your use of this website and agree to release us from any liability in connection with your use of, or reliance upon, the content or products found herein.