
|
Valoración de DCF PLC Standard Chartered (2888.HK) |
Completamente Editable: Adáptelo A Sus Necesidades En Excel O Sheets
Diseño Profesional: Plantillas Confiables Y Estándares De La Industria
Predeterminadas Para Un Uso Rápido Y Eficiente
Compatible con MAC / PC, completamente desbloqueado
No Se Necesita Experiencia; Fáciles De Seguir
Standard Chartered PLC (2888.HK) Bundle
Como inversionista o analista, la calculadora DCF PLC (2888HK) estándar (2888HK) sirve como su recurso de referencia para una valoración precisa. Precedidos con datos reales del PLC alquilado estándar, puede ajustar fácilmente los pronósticos y observar los efectos inmediatos.
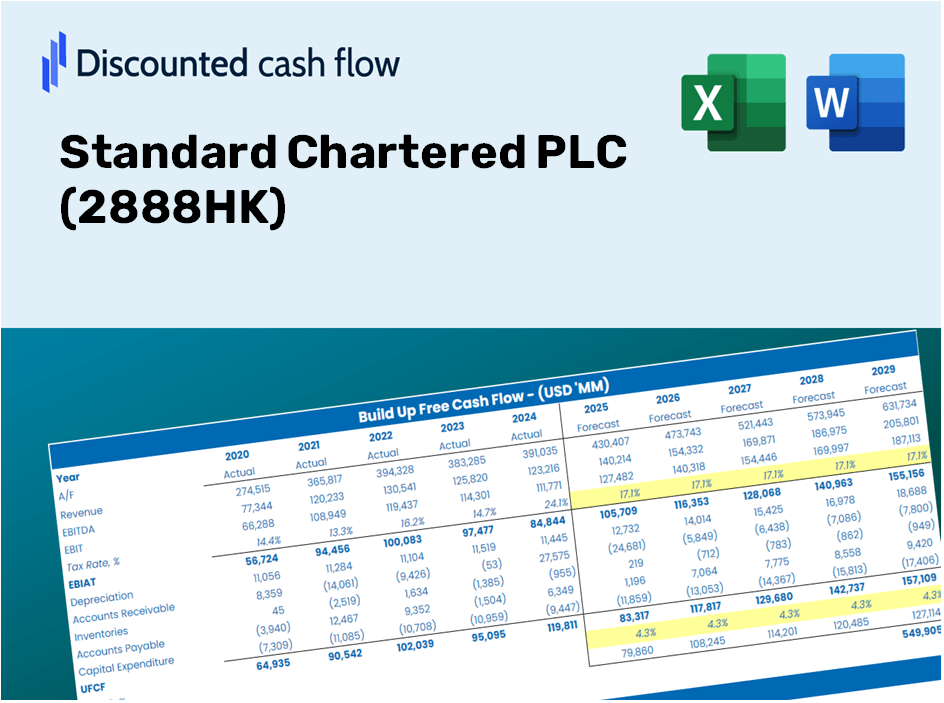
Discounted Cash Flow (DCF) - (USD MM)
| Year | AY1 2020 |
AY2 2021 |
AY3 2022 |
AY4 2023 |
AY5 2024 |
FY1 2025 |
FY2 2026 |
FY3 2027 |
FY4 2028 |
FY5 2029 |
|---|---|---|---|---|---|---|---|---|---|---|
| Revenue | 96,972.5 | 140,711.3 | 118,094.8 | 129,512.0 | 147,762.5 | 167,263.7 | 189,338.7 | 214,327.1 | 242,613.4 | 274,632.9 |
| Revenue Growth, % | 0 | 45.1 | -16.07 | 9.67 | 14.09 | 13.2 | 13.2 | 13.2 | 13.2 | 13.2 |
| EBITDA | .0 | 35,240.1 | 42,587.0 | 47,972.6 | 55,568.5 | 45,413.3 | 51,406.8 | 58,191.4 | 65,871.3 | 74,564.8 |
| EBITDA, % | 0 | 25.04 | 36.06 | 37.04 | 37.61 | 27.15 | 27.15 | 27.15 | 27.15 | 27.15 |
| Depreciation | 9,736.2 | 9,191.4 | 9,230.3 | 8,335.3 | 8,763.3 | 12,295.5 | 13,918.2 | 15,755.1 | 17,834.4 | 20,188.2 |
| Depreciation, % | 10.04 | 6.53 | 7.82 | 6.44 | 5.93 | 7.35 | 7.35 | 7.35 | 7.35 | 7.35 |
| EBIT | -9,736.2 | 26,048.7 | 33,356.7 | 39,637.3 | 46,805.2 | 33,117.8 | 37,488.6 | 42,436.3 | 48,036.9 | 54,376.7 |
| EBIT, % | -10.04 | 18.51 | 28.25 | 30.61 | 31.68 | 19.8 | 19.8 | 19.8 | 19.8 | 19.8 |
| Total Cash | 672,223.5 | 565,514.8 | 453,443.8 | 789,633.4 | 493,789.4 | 167,263.7 | 189,338.7 | 214,327.1 | 242,613.4 | 274,632.9 |
| Total Cash, percent | .0 | .0 | .0 | .0 | .0 | .0 | .0 | .0 | .0 | .0 |
| Account Receivables | .0 | .0 | .0 | .0 | .0 | .0 | .0 | .0 | .0 | .0 |
| Account Receivables, % | 0 | 0 | 0 | 0 | 0 | 0 | 0 | 0 | 0 | 0 |
| Inventories | .0 | .0 | .0 | .0 | .0 | .0 | .0 | .0 | .0 | .0 |
| Inventories, % | 0 | 0 | 0 | 0 | 0 | 0 | 0 | 0 | 0 | 0 |
| Accounts Payable | .0 | .0 | .0 | .0 | .0 | .0 | .0 | .0 | .0 | .0 |
| Accounts Payable, % | 0 | 0 | 0 | 0 | 0 | 0 | 0 | 0 | 0 | 0 |
| Capital Expenditure | -9,884.0 | -10,436.6 | -15,028.4 | -9,985.2 | -10,965.8 | -15,209.8 | -17,217.1 | -19,489.4 | -22,061.6 | -24,973.2 |
| Capital Expenditure, % | -10.19 | -7.42 | -12.73 | -7.71 | -7.42 | -9.09 | -9.09 | -9.09 | -9.09 | -9.09 |
| Tax Rate, % | 32.66 | 32.66 | 32.66 | 32.66 | 32.66 | 32.66 | 32.66 | 32.66 | 32.66 | 32.66 |
| EBITAT | -4,370.1 | 18,017.0 | 22,943.4 | 26,998.2 | 31,520.0 | 21,082.1 | 23,864.5 | 27,014.1 | 30,579.3 | 34,615.1 |
| Depreciation | ||||||||||
| Changes in Account Receivables | ||||||||||
| Changes in Inventories | ||||||||||
| Changes in Accounts Payable | ||||||||||
| Capital Expenditure | ||||||||||
| UFCF | -4,518.0 | 16,771.7 | 17,145.3 | 25,348.3 | 29,317.5 | 18,167.8 | 20,565.6 | 23,279.8 | 26,352.2 | 29,830.0 |
| WACC, % | 12.22 | 17.19 | 17.11 | 16.98 | 16.82 | 16.07 | 16.07 | 16.07 | 16.07 | 16.07 |
| PV UFCF | ||||||||||
| SUM PV UFCF | 74,491.9 | |||||||||
| Long Term Growth Rate, % | 2.00 | |||||||||
| Free cash flow (T + 1) | 30,427 | |||||||||
| Terminal Value | 216,318 | |||||||||
| Present Terminal Value | 102,701 | |||||||||
| Enterprise Value | 177,193 | |||||||||
| Net Debt | -202,187 | |||||||||
| Equity Value | 379,380 | |||||||||
| Diluted Shares Outstanding, MM | 2,610 | |||||||||
| Equity Value Per Share | 145.36 |
What You Will Receive
- Authentic Standard Chartered Data: Preloaded financial metrics – from revenue to EBIT – derived from actual and projected figures.
- Comprehensive Customization: Modify all essential parameters (yellow cells) including WACC, growth %, and tax rates.
- Immediate Valuation Adjustments: Automatic recalculations to assess the effects of changes on Standard Chartered’s fair value.
- Flexible Excel Template: Designed for easy edits, scenario analysis, and in-depth projections.
- Efficient and Precise: Avoid building models from the ground up while ensuring accuracy and adaptability.
Key Features
- 🔍 Real-Life STAN Financials: Pre-filled historical and projected data for Standard Chartered PLC (2888HK).
- ✏️ Fully Customizable Inputs: Modify all essential parameters (yellow cells) such as WACC, growth %, and tax rates.
- 📊 Professional DCF Valuation: Integrated formulas compute Standard Chartered’s intrinsic value using the Discounted Cash Flow method.
- ⚡ Instant Results: View Standard Chartered’s valuation immediately after adjustments.
- Scenario Analysis: Evaluate and contrast outcomes for different financial assumptions side-by-side.
How It Works
- Step 1: Download the Excel file for Standard Chartered PLC (2888HK).
- Step 2: Review the pre-filled financial data and forecasts for Standard Chartered PLC (2888HK).
- Step 3: Adjust key inputs such as revenue growth, WACC, and tax rates (highlighted cells) for Standard Chartered PLC (2888HK).
- Step 4: Observe the DCF model refresh in real-time as you adjust your assumptions for Standard Chartered PLC (2888HK).
- Step 5: Evaluate the outputs to inform your investment decisions regarding Standard Chartered PLC (2888HK).
Why Choose the Standard Chartered PLC ([2888HK]) Calculator?
- Accuracy: Utilizes genuine Standard Chartered financials for precise data.
- Flexibility: Built to allow users to freely test and adjust their inputs.
- Time-Saving: Eliminate the complexities of creating a DCF model from the ground up.
- Professional-Grade: Crafted with the precision and usability expected at the CFO level.
- User-Friendly: Intuitive design makes it accessible for users without advanced financial modeling skills.
Who Should Use This Product?
- Individual Investors: Make informed decisions regarding the purchase or sale of Standard Chartered PLC (2888HK) stock.
- Financial Analysts: Enhance your valuation processes with ready-to-implement financial models for Standard Chartered PLC (2888HK).
- Consultants: Provide clients with swift and precise valuation insights for Standard Chartered PLC (2888HK).
- Business Owners: Gain understanding of how major companies like Standard Chartered PLC (2888HK) are valued to inform your strategic decisions.
- Finance Students: Explore valuation techniques using real-world data and situations related to Standard Chartered PLC (2888HK).
What the Template Contains
- Pre-Filled DCF Model: Standard Chartered PLC’s financial data preloaded for immediate use.
- WACC Calculator: Comprehensive calculations for Weighted Average Cost of Capital.
- Financial Ratios: Analyze Standard Chartered PLC’s profitability, leverage, and efficiency.
- Editable Inputs: Modify assumptions such as growth, margins, and CAPEX to suit your scenarios.
- Financial Statements: Annual and quarterly reports for in-depth analysis.
- Interactive Dashboard: Effortlessly visualize key valuation metrics and outcomes.
Disclaimer
All information, articles, and product details provided on this website are for general informational and educational purposes only. We do not claim any ownership over, nor do we intend to infringe upon, any trademarks, copyrights, logos, brand names, or other intellectual property mentioned or depicted on this site. Such intellectual property remains the property of its respective owners, and any references here are made solely for identification or informational purposes, without implying any affiliation, endorsement, or partnership.
We make no representations or warranties, express or implied, regarding the accuracy, completeness, or suitability of any content or products presented. Nothing on this website should be construed as legal, tax, investment, financial, medical, or other professional advice. In addition, no part of this site—including articles or product references—constitutes a solicitation, recommendation, endorsement, advertisement, or offer to buy or sell any securities, franchises, or other financial instruments, particularly in jurisdictions where such activity would be unlawful.
All content is of a general nature and may not address the specific circumstances of any individual or entity. It is not a substitute for professional advice or services. Any actions you take based on the information provided here are strictly at your own risk. You accept full responsibility for any decisions or outcomes arising from your use of this website and agree to release us from any liability in connection with your use of, or reliance upon, the content or products found herein.