
|
SEKISUI HOUSE REIT, Inc. (3309.T) Valoración de DCF |
Completamente Editable: Adáptelo A Sus Necesidades En Excel O Sheets
Diseño Profesional: Plantillas Confiables Y Estándares De La Industria
Predeterminadas Para Un Uso Rápido Y Eficiente
Compatible con MAC / PC, completamente desbloqueado
No Se Necesita Experiencia; Fáciles De Seguir
Sekisui House Reit, Inc. (3309.T) Bundle
Ya sea que sea un inversionista o un analista, esta calculadora DCF (3309T) es su herramienta de referencia para una valoración precisa. Prelabastado con los datos reales de Sekisui House Reit, Inc., puede ajustar fácilmente los pronósticos y ver los efectos en tiempo real.
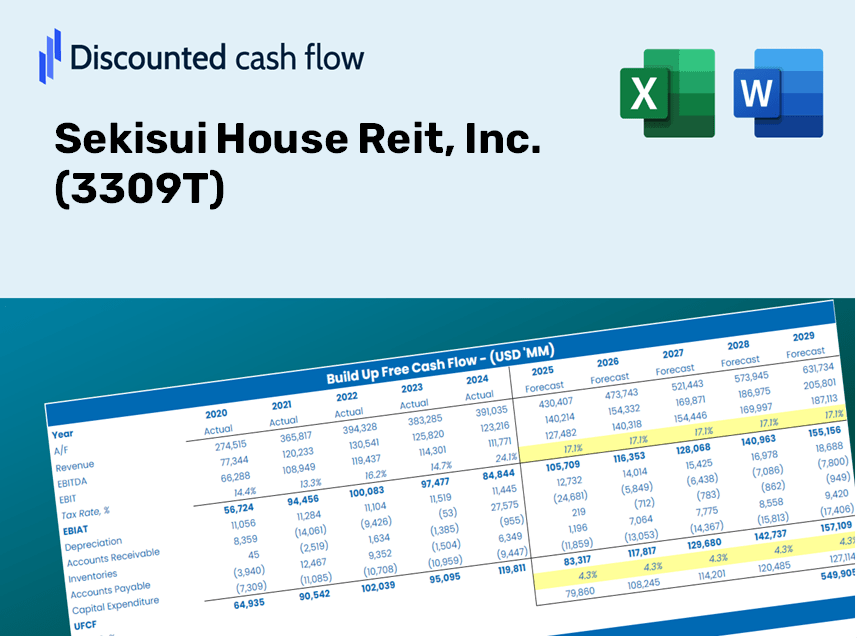
Discounted Cash Flow (DCF) - (USD MM)
| Year | AY1 2020 |
AY2 2021 |
AY3 2022 |
AY4 2023 |
AY5 2024 |
FY1 2025 |
FY2 2026 |
FY3 2027 |
FY4 2028 |
FY5 2029 |
|---|---|---|---|---|---|---|---|---|---|---|
| Revenue | 29,417.0 | 32,346.4 | 30,553.9 | 31,851.6 | 43,830.1 | 48,900.2 | 54,556.9 | 60,867.9 | 67,908.9 | 75,764.5 |
| Revenue Growth, % | 0 | 9.96 | -5.54 | 4.25 | 37.61 | 11.57 | 11.57 | 11.57 | 11.57 | 11.57 |
| EBITDA | 20,291.1 | 21,988.7 | 20,420.0 | 21,105.0 | 23,519.7 | 31,659.0 | 35,321.3 | 39,407.1 | 43,965.6 | 49,051.5 |
| EBITDA, % | 68.98 | 67.98 | 66.83 | 66.26 | 53.66 | 64.74 | 64.74 | 64.74 | 64.74 | 64.74 |
| Depreciation | 4,859.9 | 4,925.3 | 5,065.2 | 5,269.3 | 5,096.0 | 7,481.2 | 8,346.7 | 9,312.2 | 10,389.4 | 11,591.2 |
| Depreciation, % | 16.52 | 15.23 | 16.58 | 16.54 | 11.63 | 15.3 | 15.3 | 15.3 | 15.3 | 15.3 |
| EBIT | 15,431.2 | 17,063.4 | 15,354.8 | 15,835.8 | 18,423.7 | 24,177.8 | 26,974.6 | 30,095.0 | 33,576.3 | 37,460.3 |
| EBIT, % | 52.46 | 52.75 | 50.25 | 49.72 | 42.03 | 49.44 | 49.44 | 49.44 | 49.44 | 49.44 |
| Total Cash | 9,424.9 | 23,040.3 | 11,416.3 | 15,062.0 | 14,645.9 | 21,646.8 | 24,150.8 | 26,944.5 | 30,061.4 | 33,538.9 |
| Total Cash, percent | .0 | .0 | .0 | .0 | .0 | .0 | .0 | .0 | .0 | .0 |
| Account Receivables | 183.0 | 162.1 | 195.4 | 236.0 | 684.7 | 397.6 | 443.6 | 495.0 | 552.2 | 616.1 |
| Account Receivables, % | 0.62209 | 0.50116 | 0.63957 | 0.74094 | 1.56 | 0.81318 | 0.81318 | 0.81318 | 0.81318 | 0.81318 |
| Inventories | 19,237.2 | 15,288.3 | 16,643.9 | .0 | .0 | 16,345.7 | 18,236.5 | 20,346.1 | 22,699.6 | 25,325.5 |
| Inventories, % | 65.39 | 47.26 | 54.47 | 0 | 0 | 33.43 | 33.43 | 33.43 | 33.43 | 33.43 |
| Accounts Payable | 1,030.2 | 1,071.1 | 1,116.4 | 1,015.6 | 1,435.9 | 1,655.9 | 1,847.5 | 2,061.2 | 2,299.6 | 2,565.6 |
| Accounts Payable, % | 3.5 | 3.31 | 3.65 | 3.19 | 3.28 | 3.39 | 3.39 | 3.39 | 3.39 | 3.39 |
| Capital Expenditure | -7,264.4 | -11,823.8 | -51,690.3 | -2,305.6 | -63,277.0 | -26,258.1 | -29,295.6 | -32,684.4 | -36,465.3 | -40,683.5 |
| Capital Expenditure, % | -24.69 | -36.55 | -169.18 | -7.24 | -144.37 | -53.7 | -53.7 | -53.7 | -53.7 | -53.7 |
| Tax Rate, % | 0.00905838 | 0.00905838 | 0.00905838 | 0.00905838 | 0.00905838 | 0.00905838 | 0.00905838 | 0.00905838 | 0.00905838 | 0.00905838 |
| EBITAT | 15,429.9 | 17,062.1 | 15,353.4 | 15,832.0 | 18,422.0 | 24,175.0 | 26,971.5 | 30,091.5 | 33,572.4 | 37,456.0 |
| Depreciation | ||||||||||
| Changes in Account Receivables | ||||||||||
| Changes in Inventories | ||||||||||
| Changes in Accounts Payable | ||||||||||
| Capital Expenditure | ||||||||||
| UFCF | -5,364.6 | 14,174.1 | -32,615.3 | 35,298.3 | -39,787.4 | -10,440.5 | 4,277.3 | 4,772.1 | 5,324.1 | 5,940.0 |
| WACC, % | 4.25 | 4.25 | 4.25 | 4.25 | 4.25 | 4.25 | 4.25 | 4.25 | 4.25 | 4.25 |
| PV UFCF | ||||||||||
| SUM PV UFCF | 7,464.2 | |||||||||
| Long Term Growth Rate, % | 3.00 | |||||||||
| Free cash flow (T + 1) | 6,118 | |||||||||
| Terminal Value | 489,457 | |||||||||
| Present Terminal Value | 397,497 | |||||||||
| Enterprise Value | 404,962 | |||||||||
| Net Debt | 242,596 | |||||||||
| Equity Value | 162,365 | |||||||||
| Diluted Shares Outstanding, MM | 4 | |||||||||
| Equity Value Per Share | 37,057.19 |
What You Will Receive
- Authentic 3309T Financials: Provides both historical and forecast data for precise valuation.
- Customizable Inputs: Adjust key factors like WACC, tax rates, revenue growth, and capital expenditures.
- Automatic Calculations: Intrinsic value and NPV are computed in real-time.
- Scenario Analysis: Explore various scenarios to assess Sekisui House Reit’s future performance.
- User-Friendly Design: Designed for industry professionals while remaining approachable for newcomers.
Key Features
- Comprehensive Historical Data: Pre-loaded with Sekisui House Reit, Inc.'s (3309T) past financial performance and future forecasts.
- Customizable Parameters: Modify key factors such as revenue growth, profit margins, discount rates, tax implications, and capital outlays.
- Interactive Valuation Tool: Automatically recalculates Net Present Value (NPV) and intrinsic value based on your adjustments.
- Scenario Analysis: Develop various forecasting scenarios to explore multiple valuation possibilities.
- Intuitive Interface: Clean, organized layout designed for both seasoned professionals and newcomers.
How It Functions
- Download: Acquire the pre-configured Excel file featuring Sekisui House Reit, Inc.'s (3309T) financial data.
- Customize: Modify projections, such as revenue growth, EBITDA margin, and WACC.
- Automatic Updates: The calculations for intrinsic value and NPV refresh in real-time.
- Scenario Testing: Develop various projections and instantly compare results.
- Informed Decisions: Leverage the valuation outcomes to shape your investment approach.
Why Opt for This Calculator?
- All-in-One Solution: Combines DCF, WACC, and financial ratio analyses tailored for Sekisui House Reit, Inc. (3309T).
- Flexible Inputs: Modify the yellow-highlighted cells to explore different investment scenarios.
- In-Depth Analysis: Automatically computes Sekisui House's intrinsic value and Net Present Value.
- Loaded with Data: Features historical and projected data for a reliable starting point.
- High-Quality Standard: Perfect for financial analysts, investors, and business consultants focused on Sekisui House Reit, Inc. (3309T).
Who Should Utilize This Product?
- Institutional Investors: Develop comprehensive and accurate valuation models for analyzing their portfolios related to Sekisui House Reit, Inc. (3309T).
- Real Estate Finance Teams: Assess various valuation scenarios to inform corporate strategy and decision-making.
- Financial Consultants and Advisors: Deliver precise valuation insights to clients regarding Sekisui House Reit, Inc. (3309T).
- Students and Academics: Apply real-market data to enhance learning and practice in financial modeling.
- Real Estate Enthusiasts: Gain an understanding of how real estate investment trusts like Sekisui House Reit, Inc. (3309T) are evaluated in the market.
Contents of the Template
- Operating and Balance Sheet Data: Pre-filled historical data and forecasts for Sekisui House Reit, Inc. (3309T), covering revenue, EBITDA, EBIT, and capital expenditures.
- WACC Calculation: A specialized sheet for the Weighted Average Cost of Capital (WACC), detailing parameters such as Beta, risk-free rate, and share price.
- DCF Valuation (Unlevered and Levered): Customizable Discounted Cash Flow models revealing intrinsic value along with comprehensive calculations.
- Financial Statements: Pre-loaded financial statements (both annual and quarterly) to facilitate thorough analysis.
- Key Ratios: Features profitability, leverage, and efficiency ratios specific to Sekisui House Reit, Inc. (3309T).
- Dashboard and Charts: A visual summary of valuation outputs and assumptions for straightforward result analysis.
Disclaimer
All information, articles, and product details provided on this website are for general informational and educational purposes only. We do not claim any ownership over, nor do we intend to infringe upon, any trademarks, copyrights, logos, brand names, or other intellectual property mentioned or depicted on this site. Such intellectual property remains the property of its respective owners, and any references here are made solely for identification or informational purposes, without implying any affiliation, endorsement, or partnership.
We make no representations or warranties, express or implied, regarding the accuracy, completeness, or suitability of any content or products presented. Nothing on this website should be construed as legal, tax, investment, financial, medical, or other professional advice. In addition, no part of this site—including articles or product references—constitutes a solicitation, recommendation, endorsement, advertisement, or offer to buy or sell any securities, franchises, or other financial instruments, particularly in jurisdictions where such activity would be unlawful.
All content is of a general nature and may not address the specific circumstances of any individual or entity. It is not a substitute for professional advice or services. Any actions you take based on the information provided here are strictly at your own risk. You accept full responsibility for any decisions or outcomes arising from your use of this website and agree to release us from any liability in connection with your use of, or reliance upon, the content or products found herein.