
|
Meituan (3690.hk) Valoración de DCF |
Completamente Editable: Adáptelo A Sus Necesidades En Excel O Sheets
Diseño Profesional: Plantillas Confiables Y Estándares De La Industria
Predeterminadas Para Un Uso Rápido Y Eficiente
Compatible con MAC / PC, completamente desbloqueado
No Se Necesita Experiencia; Fáciles De Seguir
Meituan (3690.HK) Bundle
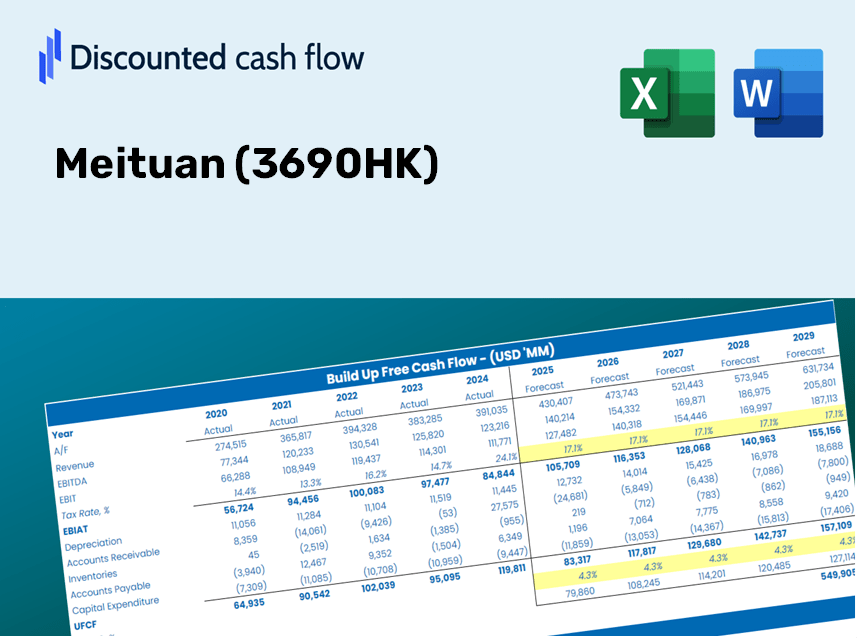
¡Simplifique la valoración de Meituan (3690HK) con esta calculadora DCF personalizable! Con finanzas de Meituan reales y entradas de pronóstico ajustables, puede probar escenarios y descubrir el valor razonable de Meituan en solo minutos.
Discounted Cash Flow (DCF) - (USD MM)
| Year | AY1 2020 |
AY2 2021 |
AY3 2022 |
AY4 2023 |
AY5 2024 |
FY1 2025 |
FY2 2026 |
FY3 2027 |
FY4 2028 |
FY5 2029 |
|---|---|---|---|---|---|---|---|---|---|---|
| Revenue | 125,516.1 | 195,858.2 | 240,498.3 | 302,592.4 | 369,122.0 | 485,985.8 | 639,848.7 | 842,424.5 | 1,109,135.7 | 1,460,287.6 |
| Revenue Growth, % | 0 | 56.04 | 22.79 | 25.82 | 21.99 | 31.66 | 31.66 | 31.66 | 31.66 | 31.66 |
| EBITDA | 1,512.8 | -14,824.0 | 372.5 | 25,632.0 | 45,388.4 | 14,150.5 | 18,630.5 | 24,529.0 | 32,294.8 | 42,519.3 |
| EBITDA, % | 1.21 | -7.57 | 0.1549 | 8.47 | 12.3 | 2.91 | 2.91 | 2.91 | 2.91 | 2.91 |
| Depreciation | 4,260.3 | 9,761.9 | 7,593.1 | 8,743.6 | 9,133.0 | 16,425.7 | 21,626.1 | 28,472.9 | 37,487.4 | 49,355.9 |
| Depreciation, % | 3.39 | 4.98 | 3.16 | 2.89 | 2.47 | 3.38 | 3.38 | 3.38 | 3.38 | 3.38 |
| EBIT | -2,747.4 | -24,585.9 | -7,220.5 | 16,888.3 | 36,255.5 | -2,275.2 | -2,995.6 | -3,944.0 | -5,192.6 | -6,836.6 |
| EBIT, % | -2.19 | -12.55 | -3 | 5.58 | 9.82 | -0.46817 | -0.46817 | -0.46817 | -0.46817 | -0.46817 |
| Total Cash | 66,798.9 | 127,703.9 | 122,495.4 | 158,718.1 | 183,956.9 | 264,031.0 | 347,623.1 | 457,680.4 | 602,581.8 | 793,358.9 |
| Total Cash, percent | .0 | .0 | .0 | .0 | .0 | .0 | .0 | .0 | .0 | .0 |
| Account Receivables | 11,111.3 | 11,281.7 | 11,270.4 | 12,678.1 | 15,398.5 | 26,885.1 | 35,396.9 | 46,603.5 | 61,358.2 | 80,784.2 |
| Account Receivables, % | 8.85 | 5.76 | 4.69 | 4.19 | 4.17 | 5.53 | 5.53 | 5.53 | 5.53 | 5.53 |
| Inventories | 510.1 | 745.4 | 1,271.4 | 1,426.4 | 1,896.1 | 2,236.2 | 2,944.1 | 3,876.3 | 5,103.5 | 6,719.2 |
| Inventories, % | 0.40637 | 0.38056 | 0.52864 | 0.47141 | 0.51368 | 0.46013 | 0.46013 | 0.46013 | 0.46013 | 0.46013 |
| Accounts Payable | 13,084.7 | 16,582.1 | 19,002.5 | 25,126.8 | 27,546.1 | 41,366.0 | 54,462.5 | 71,705.3 | 94,407.1 | 124,296.4 |
| Accounts Payable, % | 10.42 | 8.47 | 7.9 | 8.3 | 7.46 | 8.51 | 8.51 | 8.51 | 8.51 | 8.51 |
| Capital Expenditure | -17,302.4 | -9,852.0 | -6,266.6 | -7,522.1 | -12,026.8 | -26,403.6 | -34,762.9 | -45,768.9 | -60,259.3 | -79,337.3 |
| Capital Expenditure, % | -13.79 | -5.03 | -2.61 | -2.49 | -3.26 | -5.43 | -5.43 | -5.43 | -5.43 | -5.43 |
| Tax Rate, % | 5.73 | 5.73 | 5.73 | 5.73 | 5.73 | 5.73 | 5.73 | 5.73 | 5.73 | 5.73 |
| EBITAT | -2,914.9 | -24,554.3 | -7,145.5 | 16,688.3 | 34,176.4 | -2,238.4 | -2,947.1 | -3,880.2 | -5,108.6 | -6,726.0 |
| Depreciation | ||||||||||
| Changes in Account Receivables | ||||||||||
| Changes in Inventories | ||||||||||
| Changes in Accounts Payable | ||||||||||
| Capital Expenditure | ||||||||||
| UFCF | -14,493.6 | -21,552.9 | -3,913.3 | 22,471.4 | 30,511.8 | -10,223.1 | -12,207.3 | -16,072.1 | -21,160.5 | -27,859.9 |
| WACC, % | 5.01 | 5.01 | 5.01 | 5.01 | 4.99 | 5.01 | 5.01 | 5.01 | 5.01 | 5.01 |
| PV UFCF | ||||||||||
| SUM PV UFCF | -73,910.4 | |||||||||
| Long Term Growth Rate, % | 3.50 | |||||||||
| Free cash flow (T + 1) | -28,835 | |||||||||
| Terminal Value | -1,911,911 | |||||||||
| Present Terminal Value | -1,497,449 | |||||||||
| Enterprise Value | -1,571,359 | |||||||||
| Net Debt | -10,195 | |||||||||
| Equity Value | -1,561,164 | |||||||||
| Diluted Shares Outstanding, MM | 6,226 | |||||||||
| Equity Value Per Share | -250.76 |
Benefits You Will Receive
- Pre-Filled Financial Model: Accurate DCF valuation powered by Meituan's (3690HK) actual data.
- Comprehensive Forecast Control: Modify revenue growth, profit margins, WACC, and other critical factors.
- Real-Time Calculations: Automatic updates provide immediate results as you adjust inputs.
- Investor-Ready Template: A polished Excel file crafted for high-quality valuation.
- Flexible and Reusable: Designed for adaptability, allowing for repeated application in detailed forecasting.
Key Features
- Real-Time Meituan Data: Pre-loaded with Meituan’s historical financials and future projections.
- Customizable Inputs: Tailor revenue growth, margins, WACC, tax rates, and capital expenditures to your needs.
- Dynamic Valuation Model: Automatic recalculation of Net Present Value (NPV) and intrinsic value based on your adjustments.
- Scenario Analysis: Develop multiple forecasting scenarios to evaluate different valuation outcomes.
- User-Centered Design: Intuitive, organized, and suitable for both experienced professionals and novices.
How It Functions
- Download: Obtain the ready-to-use Excel file featuring Meituan’s (3690HK) financial data.
- Customize: Modify projections, including revenue growth, EBITDA %, and WACC.
- Update Automatically: The intrinsic value and NPV calculations refresh in real-time.
- Test Scenarios: Develop various forecasts and instantly compare results.
- Make Decisions: Utilize the valuation outcomes to inform your investment approach.
Why Opt for This Calculator?
- Precision: Reliable Meituan financials guarantee data integrity.
- Versatility: Tailored for users to effortlessly adjust and test inputs.
- Efficiency: Eliminate the complexity of creating a DCF model from the ground up.
- Expert-Level: Crafted with CFO-level accuracy and user experience in mind.
- Intuitive: Simple to navigate, even for individuals without extensive financial modeling skills.
Who Can Benefit from This Product?
- Individual Investors: Make well-informed choices regarding the purchase or sale of Meituan (3690HK) stock.
- Financial Analysts: Enhance valuation methodologies with ready-to-apply financial models focused on Meituan (3690HK).
- Consultants: Provide clients with prompt and accurate valuation insights on Meituan (3690HK).
- Business Owners: Gain a deeper understanding of how large companies like Meituan (3690HK) are valued to inform your strategic planning.
- Finance Students: Explore valuation techniques through the analysis of real-world data and examples related to Meituan (3690HK).
Components of the Template
- Pre-Filled DCF Model: Meituan’s financial data preloaded for immediate application.
- WACC Calculator: Comprehensive calculations for the Weighted Average Cost of Capital.
- Financial Ratios: Assess Meituan’s profitability, leverage, and operational efficiency.
- Editable Inputs: Modify assumptions like growth, margins, and CAPEX to suit your scenarios.
- Financial Statements: Annual and quarterly reports provided for in-depth analysis.
- Interactive Dashboard: Effortlessly visualize essential valuation metrics and outcomes.
Disclaimer
All information, articles, and product details provided on this website are for general informational and educational purposes only. We do not claim any ownership over, nor do we intend to infringe upon, any trademarks, copyrights, logos, brand names, or other intellectual property mentioned or depicted on this site. Such intellectual property remains the property of its respective owners, and any references here are made solely for identification or informational purposes, without implying any affiliation, endorsement, or partnership.
We make no representations or warranties, express or implied, regarding the accuracy, completeness, or suitability of any content or products presented. Nothing on this website should be construed as legal, tax, investment, financial, medical, or other professional advice. In addition, no part of this site—including articles or product references—constitutes a solicitation, recommendation, endorsement, advertisement, or offer to buy or sell any securities, franchises, or other financial instruments, particularly in jurisdictions where such activity would be unlawful.
All content is of a general nature and may not address the specific circumstances of any individual or entity. It is not a substitute for professional advice or services. Any actions you take based on the information provided here are strictly at your own risk. You accept full responsibility for any decisions or outcomes arising from your use of this website and agree to release us from any liability in connection with your use of, or reliance upon, the content or products found herein.