
|
Mitsubishi Chemical Group Corporation (4188.T) Valoración de DCF |
Completamente Editable: Adáptelo A Sus Necesidades En Excel O Sheets
Diseño Profesional: Plantillas Confiables Y Estándares De La Industria
Predeterminadas Para Un Uso Rápido Y Eficiente
Compatible con MAC / PC, completamente desbloqueado
No Se Necesita Experiencia; Fáciles De Seguir
Mitsubishi Chemical Group Corporation (4188.T) Bundle
¡Descubra el verdadero valor de Mitsubishi Chemical Group Corporation con nuestra calculadora DCF de primer nivel! Ajuste los supuestos clave, explore varios escenarios y evalúe cómo los cambios afectan la valoración de Mitsubishi Chemical Group Corporation, todo dentro de una sola plantilla de Excel.
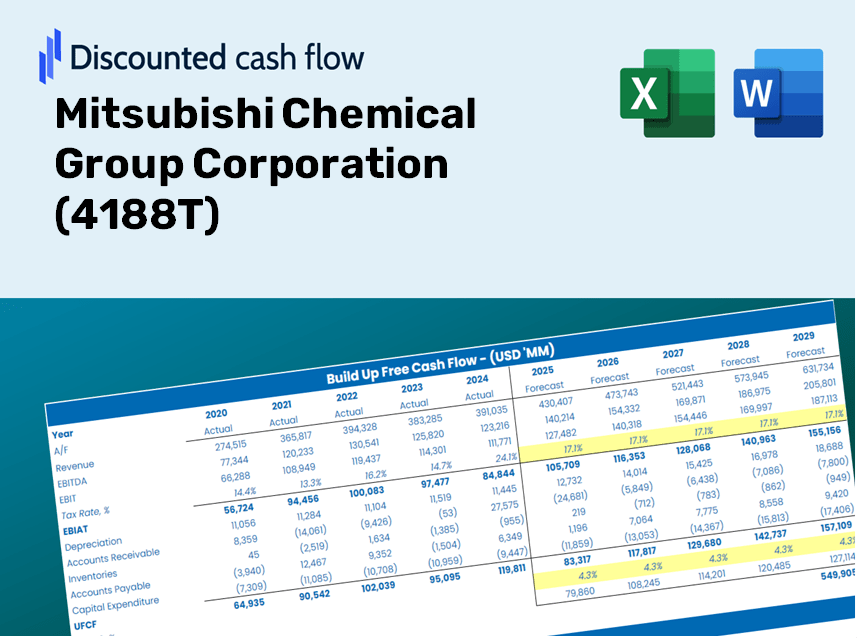
Discounted Cash Flow (DCF) - (USD MM)
| Year | AY1 2021 |
AY2 2022 |
AY3 2023 |
AY4 2024 |
AY5 2025 |
FY1 2026 |
FY2 2027 |
FY3 2028 |
FY4 2029 |
FY5 2030 |
|---|---|---|---|---|---|---|---|---|---|---|
| Revenue | 3,257,535.0 | 3,976,948.0 | 4,634,532.0 | 4,387,218.0 | 4,407,405.0 | 4,234,426.0 | 4,068,236.0 | 3,908,568.5 | 3,755,167.6 | 3,607,787.2 |
| Revenue Growth, % | 0 | 22.08 | 16.53 | -5.34 | 0.46013 | -3.92 | -3.92 | -3.92 | -3.92 | -3.92 |
| EBITDA | 283,923.0 | 542,837.0 | 456,718.0 | 561,063.0 | 205,682.0 | 420,694.2 | 404,183.0 | 388,319.9 | 373,079.4 | 358,437.0 |
| EBITDA, % | 8.72 | 13.65 | 9.85 | 12.79 | 4.67 | 9.94 | 9.94 | 9.94 | 9.94 | 9.94 |
| Depreciation | 243,793.0 | 251,469.0 | 269,616.0 | 275,436.0 | 275,933.0 | 272,387.9 | 261,697.4 | 251,426.5 | 241,558.6 | 232,078.1 |
| Depreciation, % | 7.48 | 6.32 | 5.82 | 6.28 | 6.26 | 6.43 | 6.43 | 6.43 | 6.43 | 6.43 |
| EBIT | 40,130.0 | 291,368.0 | 187,102.0 | 285,627.0 | -70,251.0 | 148,306.3 | 142,485.6 | 136,893.5 | 131,520.7 | 126,358.9 |
| EBIT, % | 1.23 | 7.33 | 4.04 | 6.51 | -1.59 | 3.5 | 3.5 | 3.5 | 3.5 | 3.5 |
| Total Cash | 349,577.0 | 245,789.0 | 297,224.0 | 377,728.0 | 392,247.0 | 345,820.4 | 332,247.9 | 319,208.0 | 306,680.0 | 294,643.6 |
| Total Cash, percent | .0 | .0 | .0 | .0 | .0 | .0 | .0 | .0 | .0 | .0 |
| Account Receivables | 716,392.0 | 825,996.0 | 808,787.0 | 852,353.0 | 764,814.0 | 821,426.0 | 789,187.2 | 758,213.7 | 728,455.9 | 699,865.9 |
| Account Receivables, % | 21.99 | 20.77 | 17.45 | 19.43 | 17.35 | 19.4 | 19.4 | 19.4 | 19.4 | 19.4 |
| Inventories | 576,473.0 | 745,248.0 | 797,877.0 | 799,249.0 | 759,423.0 | 754,574.7 | 724,959.6 | 696,506.9 | 669,170.8 | 642,907.7 |
| Inventories, % | 17.7 | 18.74 | 17.22 | 18.22 | 17.23 | 17.82 | 17.82 | 17.82 | 17.82 | 17.82 |
| Accounts Payable | 382,272.0 | 486,874.0 | 476,311.0 | 501,532.0 | 424,635.0 | 468,506.1 | 450,118.5 | 432,452.5 | 415,479.9 | 399,173.4 |
| Accounts Payable, % | 11.74 | 12.24 | 10.28 | 11.43 | 9.63 | 11.06 | 11.06 | 11.06 | 11.06 | 11.06 |
| Capital Expenditure | -257,016.0 | -257,665.0 | -280,995.0 | -274,472.0 | -314,533.0 | -286,455.3 | -275,212.7 | -264,411.3 | -254,033.8 | -244,063.7 |
| Capital Expenditure, % | -7.89 | -6.48 | -6.06 | -6.26 | -7.14 | -6.76 | -6.76 | -6.76 | -6.76 | -6.76 |
| Tax Rate, % | 70.13 | 70.13 | 70.13 | 70.13 | 70.13 | 70.13 | 70.13 | 70.13 | 70.13 | 70.13 |
| EBITAT | -9,215.5 | 177,770.9 | 107,451.9 | 142,009.0 | -20,987.4 | 58,739.8 | 56,434.4 | 54,219.5 | 52,091.5 | 50,047.1 |
| Depreciation | ||||||||||
| Changes in Account Receivables | ||||||||||
| Changes in Inventories | ||||||||||
| Changes in Accounts Payable | ||||||||||
| Capital Expenditure | ||||||||||
| UFCF | -933,031.5 | -2,202.1 | 50,089.9 | 123,256.0 | -9,119.4 | 36,779.8 | 86,385.4 | 82,995.0 | 79,737.6 | 76,608.1 |
| WACC, % | 1.86 | 3.25 | 3.17 | 2.99 | 2.54 | 2.76 | 2.76 | 2.76 | 2.76 | 2.76 |
| PV UFCF | ||||||||||
| SUM PV UFCF | 332,434.2 | |||||||||
| Long Term Growth Rate, % | 2.00 | |||||||||
| Free cash flow (T + 1) | 78,140 | |||||||||
| Terminal Value | 10,256,851 | |||||||||
| Present Terminal Value | 8,950,654 | |||||||||
| Enterprise Value | 9,283,088 | |||||||||
| Net Debt | 1,714,843 | |||||||||
| Equity Value | 7,568,245 | |||||||||
| Diluted Shares Outstanding, MM | 1,423 | |||||||||
| Equity Value Per Share | 5,316.79 |
Benefits You Will Receive
- Adjustable Forecast Parameters: Effortlessly modify assumptions (growth %, margins, WACC) to explore various scenarios.
- Comprehensive Data: Mitsubishi Chemical Group Corporation’s financial data pre-loaded to facilitate your analysis.
- Automated DCF Calculations: The template computes Net Present Value (NPV) and intrinsic value automatically.
- Customizable and Sleek: A refined Excel model tailored to suit your valuation requirements.
- Designed for Analysts and Investors: Perfect for testing forecasts, validating strategies, and optimizing your time.
Key Features
- Real-Time (4188T) Data: Pre-populated with Mitsubishi Chemical Group Corporation’s historical financial figures and future projections.
- Customizable Variables: Modify revenue growth, profit margins, weighted average cost of capital (WACC), tax rates, and capital expenditures to suit your analysis.
- Dynamic Valuation Framework: Automatic recalculations of Net Present Value (NPV) and intrinsic value based on your custom inputs.
- Scenario Analysis: Develop various forecasting scenarios to evaluate different potential valuation results.
- User-Friendly Interface: Intuitive design that caters to both seasoned professionals and newcomers.
How It Functions
- 1. Access the Template: Download and open the Excel file containing Mitsubishi Chemical Group Corporation’s (4188T) preloaded data.
- 2. Modify Key Assumptions: Adjust important inputs such as growth rates, WACC, and capital expenditures.
- 3. Instant Results: The DCF model automatically computes the intrinsic value and NPV in real-time.
- 4. Explore Scenarios: Evaluate various forecasts to investigate different valuation possibilities.
- 5. Present with Assurance: Provide professional valuation insights to bolster your decision-making process.
Why Choose This Calculator for Mitsubishi Chemical Group Corporation (4188T)?
- Precision: Leveraging real financial data from Mitsubishi Chemical for utmost accuracy.
- Versatility: Built to allow users to easily experiment with and adjust inputs.
- Efficiency: Eliminate the need to create a DCF model from the ground up.
- High-Quality Standards: Crafted with the accuracy and usability expected by CFOs.
- Accessible: Intuitive to use, even for individuals who may not have extensive financial modeling skills.
Who Can Benefit from This Product?
- Investors: Assess Mitsubishi Chemical Group Corporation’s valuation before making stock decisions.
- CFOs and Financial Analysts: Enhance valuation workflows and validate financial forecasts.
- Startup Founders: Discover the valuation methods applied to large public companies like Mitsubishi Chemical Group Corporation (4188T).
- Consultants: Provide clients with expert valuation analysis and reports.
- Students and Educators: Utilize actual market data to learn and teach valuation strategies.
Contents of the Template
- Pre-Filled DCF Model: Mitsubishi Chemical Group Corporation’s financial data preloaded for immediate analysis.
- WACC Calculator: Comprehensive calculations for Weighted Average Cost of Capital.
- Financial Ratios: Assess Mitsubishi Chemical Group Corporation’s profitability, leverage, and efficiency.
- Editable Inputs: Modify assumptions such as growth rates, margins, and CAPEX to suit your scenarios.
- Financial Statements: Annual and quarterly reports for in-depth analysis.
- Interactive Dashboard: Easily visualize key valuation metrics and outcomes.
Disclaimer
All information, articles, and product details provided on this website are for general informational and educational purposes only. We do not claim any ownership over, nor do we intend to infringe upon, any trademarks, copyrights, logos, brand names, or other intellectual property mentioned or depicted on this site. Such intellectual property remains the property of its respective owners, and any references here are made solely for identification or informational purposes, without implying any affiliation, endorsement, or partnership.
We make no representations or warranties, express or implied, regarding the accuracy, completeness, or suitability of any content or products presented. Nothing on this website should be construed as legal, tax, investment, financial, medical, or other professional advice. In addition, no part of this site—including articles or product references—constitutes a solicitation, recommendation, endorsement, advertisement, or offer to buy or sell any securities, franchises, or other financial instruments, particularly in jurisdictions where such activity would be unlawful.
All content is of a general nature and may not address the specific circumstances of any individual or entity. It is not a substitute for professional advice or services. Any actions you take based on the information provided here are strictly at your own risk. You accept full responsibility for any decisions or outcomes arising from your use of this website and agree to release us from any liability in connection with your use of, or reliance upon, the content or products found herein.