
|
Terumo Corporation (4543.T) Valoración de DCF |
Completamente Editable: Adáptelo A Sus Necesidades En Excel O Sheets
Diseño Profesional: Plantillas Confiables Y Estándares De La Industria
Predeterminadas Para Un Uso Rápido Y Eficiente
Compatible con MAC / PC, completamente desbloqueado
No Se Necesita Experiencia; Fáciles De Seguir
Terumo Corporation (4543.T) Bundle
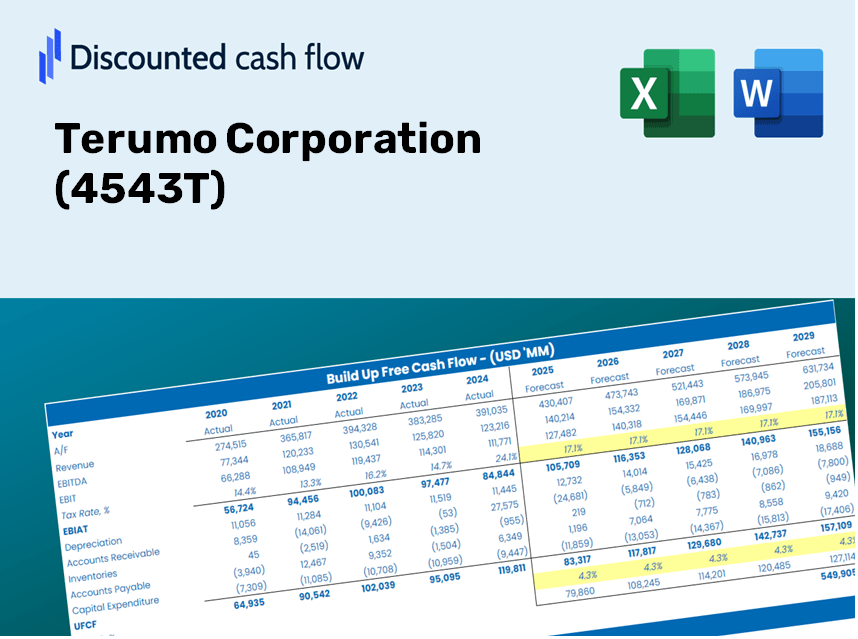
¡Mejore sus opciones de inversión con la calculadora DCF de Terumo Corporation (4543T)! Explore los datos financieros auténticos de Terumo, ajuste las predicciones y gastos de crecimiento, y observe instantáneamente cómo estas modificaciones afectan el valor intrínseco de Terumo Corporation (4543T).
What You Will Receive
- Customizable Excel Template: A fully adaptable Excel DCF Calculator featuring pre-populated financial data for Terumo Corporation (4543T).
- Market Data Insights: Access to historical data and forward-looking projections (highlighted in the yellow cells).
- Flexible Forecasting: Modify assumptions for revenue growth, EBITDA margin, and WACC as needed.
- Instant Calculations: Quickly visualize how your adjustments affect Terumo Corporation's (4543T) valuation.
- Professional Resource: Designed for investors, CFOs, consultants, and financial analysts alike.
- User-Friendly Layout: Organized for ease of understanding and navigation, complete with clear step-by-step guidance.
Key Features
- Real-Time 4543T Data: Pre-filled with Terumo Corporation’s historical financials and forward-looking projections.
- Fully Customizable Inputs: Modify revenue growth rates, profit margins, WACC, tax rates, and capital expenditures to suit your analysis.
- Dynamic Valuation Model: Automatically recalculates Net Present Value (NPV) and intrinsic value based on your customized inputs.
- Scenario Analysis: Develop multiple forecasting scenarios to explore various valuation outcomes.
- User-Friendly Interface: Intuitive and organized, designed for both professionals and novices.
How It Functions
- Download: Obtain the pre-configured Excel file containing Terumo Corporation’s financial data.
- Customize: Modify forecasts such as revenue growth, EBITDA %, and WACC as needed.
- Update Automatically: Watch as intrinsic value and NPV calculations refresh in real-time.
- Test Scenarios: Develop various projections and instantly compare results.
- Make Decisions: Utilize the valuation outcomes to inform your investment strategy.
Why Opt for This Calculator?
- All-in-One Solution: Combines DCF, WACC, and financial ratio analysis seamlessly.
- Flexible Inputs: Modify the highlighted cells to explore different financial scenarios.
- In-Depth Analysis: Automatically derives Terumo Corporation’s intrinsic value and Net Present Value.
- Ready-to-Use Data: Historical and projected figures provide a solid foundation for analysis.
- High-Caliber Tool: Perfect for financial analysts, investors, and business consultants working with Terumo Corporation (4543T).
Who Should Utilize This Product?
- Investors: Accurately assess Terumo Corporation’s (4543T) fair value prior to making investment choices.
- CFOs: Utilize a professional-grade DCF model for comprehensive financial reporting and analysis.
- Consultants: Easily customize the template for valuation reports tailored to clients.
- Entrepreneurs: Acquire insights into financial modeling practices employed by leading corporations.
- Educators: Implement it as a resource to illustrate valuation techniques in the classroom.
Contents of the Template
- Comprehensive DCF Model: An editable template featuring intricate valuation calculations.
- Real-World Data: Terumo Corporation's (4543T) historical and projected financials preloaded for your analysis.
- Customizable Parameters: Modify WACC, growth rates, and tax assumptions to explore different scenarios.
- Financial Statements: Detailed annual and quarterly breakdowns for enhanced insights.
- Key Ratios: Integrated analysis for assessing profitability, efficiency, and leverage.
- Dashboard with Visual Outputs: Charts and tables designed for clear, actionable insights.
Disclaimer
All information, articles, and product details provided on this website are for general informational and educational purposes only. We do not claim any ownership over, nor do we intend to infringe upon, any trademarks, copyrights, logos, brand names, or other intellectual property mentioned or depicted on this site. Such intellectual property remains the property of its respective owners, and any references here are made solely for identification or informational purposes, without implying any affiliation, endorsement, or partnership.
We make no representations or warranties, express or implied, regarding the accuracy, completeness, or suitability of any content or products presented. Nothing on this website should be construed as legal, tax, investment, financial, medical, or other professional advice. In addition, no part of this site—including articles or product references—constitutes a solicitation, recommendation, endorsement, advertisement, or offer to buy or sell any securities, franchises, or other financial instruments, particularly in jurisdictions where such activity would be unlawful.
All content is of a general nature and may not address the specific circumstances of any individual or entity. It is not a substitute for professional advice or services. Any actions you take based on the information provided here are strictly at your own risk. You accept full responsibility for any decisions or outcomes arising from your use of this website and agree to release us from any liability in connection with your use of, or reliance upon, the content or products found herein.