
|
Noevir Holdings Co., Ltd. (4928.T) Valoración de DCF |
Completamente Editable: Adáptelo A Sus Necesidades En Excel O Sheets
Diseño Profesional: Plantillas Confiables Y Estándares De La Industria
Predeterminadas Para Un Uso Rápido Y Eficiente
Compatible con MAC / PC, completamente desbloqueado
No Se Necesita Experiencia; Fáciles De Seguir
Noevir Holdings Co., Ltd. (4928.T) Bundle
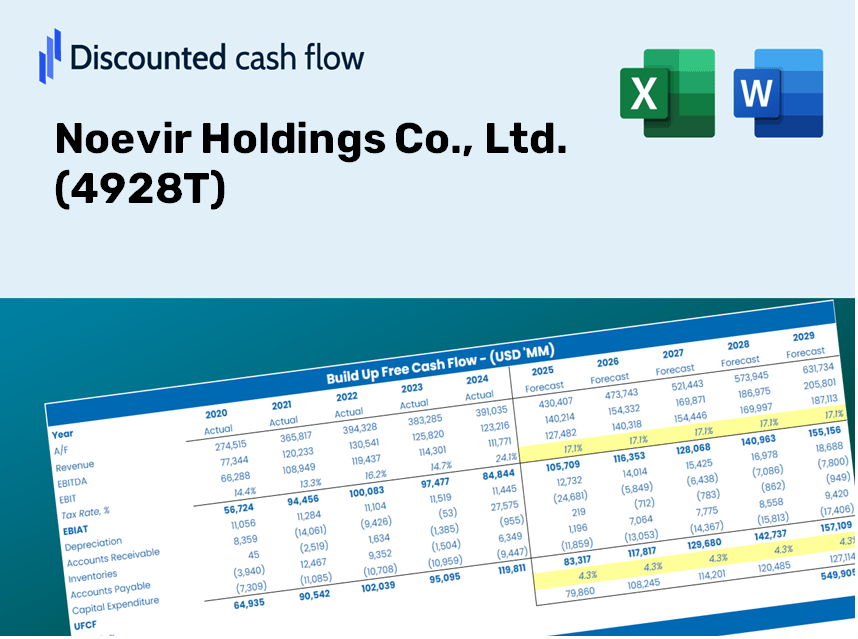
¿Busca determinar el valor intrínseco de Noevir Holdings Co., Ltd.? Nuestra calculadora DCF (4928T) integra datos del mundo real con extensas funciones de personalización, lo que le permite refinar sus proyecciones y mejorar sus estrategias de inversión.
What You Will Receive
- Real Noevir Financials: Access to historical and projected data for precise valuation.
- Customizable Inputs: Adjust WACC, tax rates, revenue growth, and capital expenditures as needed.
- Automatic Calculations: Dynamic calculation of intrinsic value and NPV.
- Scenario Analysis: Explore various scenarios to assess Noevir’s future performance.
- Clear and User-Friendly Design: Tailored for professionals, yet user-friendly for newcomers.
Essential Features
- Customizable Financial Inputs: Adjust vital metrics such as revenue growth, EBITDA percentage, and capital expenditures.
- Instant DCF Valuation: Quickly calculates intrinsic value, NPV, and additional metrics effortlessly.
- Precision That Professionals Trust: Leverages Noevir's actual financial data for accurate valuation results.
- Streamlined Scenario Testing: Easily explore various assumptions and assess different outcomes.
- Efficiency Booster: Say goodbye to the hassle of constructing intricate valuation models from the ground up.
How It Works
- Step 1: Download the Excel file for Noevir Holdings Co., Ltd. (4928T).
- Step 2: Review Noevir's pre-filled financial data and forecasts.
- Step 3: Modify key inputs such as revenue growth, WACC, and tax rates (highlighted cells).
- Step 4: Observe the DCF model update in real-time as you adjust the assumptions.
- Step 5: Examine the outputs and leverage the results for your investment decisions.
Why Choose This Calculator for Noevir Holdings Co., Ltd. (4928T)?
- User-Friendly Interface: Crafted for both novices and seasoned professionals.
- Customizable Parameters: Effortlessly adjust inputs to tailor your financial analysis.
- Real-Time Valuation Updates: Observe immediate changes in Noevir’s valuation as you modify inputs.
- Pre-Configured Data: Comes with Noevir’s actual financial metrics for swift evaluations.
- Relied On by Experts: Trusted by investors and analysts for making well-informed choices.
Who Should Use Noevir Holdings Co., Ltd. (4928T)?
- Investors: Gain insights and make informed decisions with our advanced valuation resources.
- Financial Analysts: Streamline your workflow with a customizable DCF model tailored for Noevir Holdings Co., Ltd. (4928T).
- Consultants: Easily modify the template for impactful client presentations or comprehensive reports.
- Finance Enthusiasts: Enhance your knowledge of valuation methods through real-world applications specific to Noevir Holdings Co., Ltd. (4928T).
- Educators and Students: Utilize this tool for hands-on learning in finance-related studies focused on Noevir Holdings Co., Ltd. (4928T).
Contents of the Template
- Comprehensive DCF Model: Editable template featuring detailed valuation calculations.
- Real-World Data: Noevir Holdings Co., Ltd.'s historical and projected financials preloaded for analysis.
- Customizable Parameters: Modify WACC, growth rates, and tax assumptions to explore different scenarios.
- Financial Statements: Complete annual and quarterly breakdowns for enhanced insights.
- Key Ratios: Integrated analysis covering profitability, efficiency, and leverage metrics.
- Dashboard with Visual Outputs: Charts and tables presenting clear, actionable results.
Disclaimer
All information, articles, and product details provided on this website are for general informational and educational purposes only. We do not claim any ownership over, nor do we intend to infringe upon, any trademarks, copyrights, logos, brand names, or other intellectual property mentioned or depicted on this site. Such intellectual property remains the property of its respective owners, and any references here are made solely for identification or informational purposes, without implying any affiliation, endorsement, or partnership.
We make no representations or warranties, express or implied, regarding the accuracy, completeness, or suitability of any content or products presented. Nothing on this website should be construed as legal, tax, investment, financial, medical, or other professional advice. In addition, no part of this site—including articles or product references—constitutes a solicitation, recommendation, endorsement, advertisement, or offer to buy or sell any securities, franchises, or other financial instruments, particularly in jurisdictions where such activity would be unlawful.
All content is of a general nature and may not address the specific circumstances of any individual or entity. It is not a substitute for professional advice or services. Any actions you take based on the information provided here are strictly at your own risk. You accept full responsibility for any decisions or outcomes arising from your use of this website and agree to release us from any liability in connection with your use of, or reliance upon, the content or products found herein.