
|
Xiamen C&D Inc. (600153.SS) Valoración DCF |
Completamente Editable: Adáptelo A Sus Necesidades En Excel O Sheets
Diseño Profesional: Plantillas Confiables Y Estándares De La Industria
Predeterminadas Para Un Uso Rápido Y Eficiente
Compatible con MAC / PC, completamente desbloqueado
No Se Necesita Experiencia; Fáciles De Seguir
Xiamen C&D Inc. (600153.SS) Bundle
Ya sea que sea un inversor o analista, esta calculadora DCF (600153SS) es su recurso de referencia para una valoración precisa. Con datos reales de Xiamen C&D Inc., puede ajustar las previsiones y observar los efectos en tiempo real.
What You Will Gain
- Flexible Forecast Parameters: Adjust key assumptions (growth %, profit margins, WACC) effortlessly to explore various scenarios.
- Real-World Financial Data: Pre-filled financial information for Xiamen C&D Inc. (600153SS) to kickstart your analysis.
- Automated DCF Calculations: The model calculates Net Present Value (NPV) and intrinsic value automatically for your convenience.
- Tailorable and Professional Design: A sleek Excel template that can be customized to meet your valuation requirements.
- Designed for Analysts and Investors: Perfect for evaluating forecasts, confirming strategies, and enhancing efficiency.
Key Features
- Customizable Forecast Inputs: Adjust essential parameters such as revenue growth, EBITDA %, and capital expenditures.
- Instant DCF Valuation: Quickly computes intrinsic value, NPV, and other key metrics.
- High-Precision Accuracy: Leverages Xiamen C&D Inc.'s (600153SS) actual financial data for reliable valuation results.
- Simplified Scenario Analysis: Easily test various assumptions and compare results side by side.
- Efficiency Booster: Avoid the hassle of creating intricate valuation models from the ground up.
How It Works
- Step 1: Download the Excel file.
- Step 2: Examine the pre-filled data for Xiamen C&D Inc. (600153SS) including historical and projected figures.
- Step 3: Modify key assumptions (highlighted in yellow) based on your own analysis.
- Step 4: Observe the automatic recalculations of Xiamen C&D Inc.'s (600153SS) intrinsic value.
- Step 5: Utilize the results for making investment choices or for reporting purposes.
Why Choose This Calculator for Xiamen C&D Inc. (600153SS)?
- Reliable Data: Utilize accurate financial information from Xiamen C&D Inc. to achieve trustworthy valuation outcomes.
- Personalizable: Modify essential parameters such as growth rates, WACC, and tax rates to align with your specific forecasts.
- Time-Efficient: Built-in calculations save you the hassle of starting from scratch.
- Professional-Quality Tool: Tailored for investors, analysts, and consultants alike.
- User-Friendly: The intuitive design and step-by-step guidance simplify the process for all users.
Who Can Benefit from This Product?
- Investors: Make informed investment choices by accurately assessing the fair value of Xiamen C&D Inc. (600153SS).
- CFOs: Utilize a high-quality DCF model for comprehensive financial reporting and analysis.
- Consultants: Easily customize the template for client valuation reports.
- Entrepreneurs: Learn financial modeling techniques employed by leading corporations.
- Educators: Employ it as a resource to illustrate various valuation methodologies.
Contents of the Template
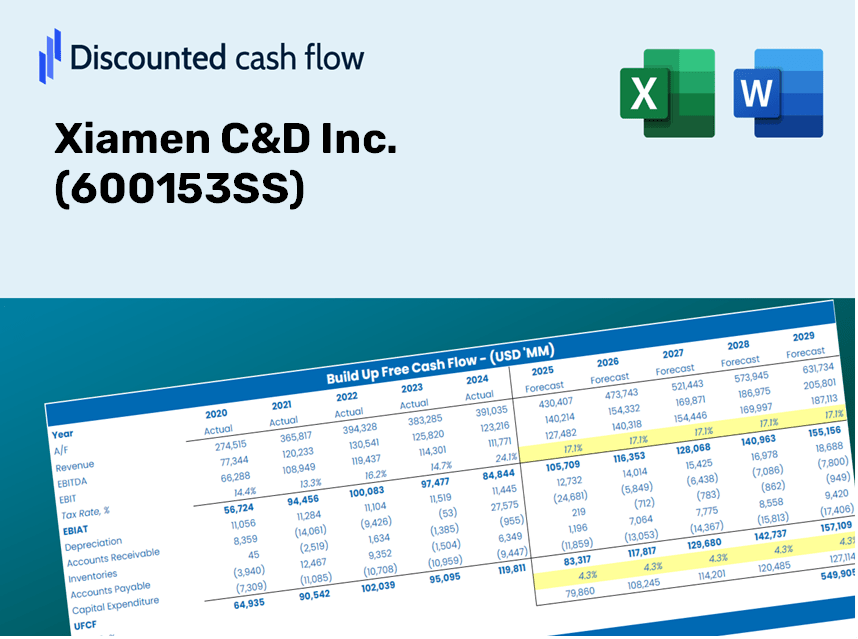
- Operating and Balance Sheet Data: Pre-filled historical data and forecasts for Xiamen C&D Inc. (600153SS), including revenue, EBITDA, EBIT, and capital expenditures.
- WACC Calculation: A dedicated sheet for Weighted Average Cost of Capital (WACC), featuring key parameters such as Beta, risk-free rate, and share price.
- DCF Valuation (Unlevered and Levered): Customizable Discounted Cash Flow models that reveal intrinsic value with comprehensive calculations.
- Financial Statements: Pre-loaded annual and quarterly financial statements to assist in your analysis.
- Key Ratios: Includes profitability, leverage, and efficiency ratios specific to Xiamen C&D Inc. (600153SS).
- Dashboard and Charts: A visual summary of valuation outputs and assumptions for straightforward result analysis.
Disclaimer
All information, articles, and product details provided on this website are for general informational and educational purposes only. We do not claim any ownership over, nor do we intend to infringe upon, any trademarks, copyrights, logos, brand names, or other intellectual property mentioned or depicted on this site. Such intellectual property remains the property of its respective owners, and any references here are made solely for identification or informational purposes, without implying any affiliation, endorsement, or partnership.
We make no representations or warranties, express or implied, regarding the accuracy, completeness, or suitability of any content or products presented. Nothing on this website should be construed as legal, tax, investment, financial, medical, or other professional advice. In addition, no part of this site—including articles or product references—constitutes a solicitation, recommendation, endorsement, advertisement, or offer to buy or sell any securities, franchises, or other financial instruments, particularly in jurisdictions where such activity would be unlawful.
All content is of a general nature and may not address the specific circumstances of any individual or entity. It is not a substitute for professional advice or services. Any actions you take based on the information provided here are strictly at your own risk. You accept full responsibility for any decisions or outcomes arising from your use of this website and agree to release us from any liability in connection with your use of, or reliance upon, the content or products found herein.