
|
Jiangsu Yangnong Chemical Co., Ltd. (600486.SS) Valoración de DCF |
Completamente Editable: Adáptelo A Sus Necesidades En Excel O Sheets
Diseño Profesional: Plantillas Confiables Y Estándares De La Industria
Predeterminadas Para Un Uso Rápido Y Eficiente
Compatible con MAC / PC, completamente desbloqueado
No Se Necesita Experiencia; Fáciles De Seguir
Jiangsu Yangnong Chemical Co., Ltd. (600486.SS) Bundle
¿Busca determinar el valor intrínseco de Jiangsu Yangnong Chemical Co., Ltd.? Nuestra calculadora DCF (600486SS) integra datos del mundo real con extensas funciones de personalización, lo que le permite refinar sus pronósticos y mejorar sus opciones de inversión.
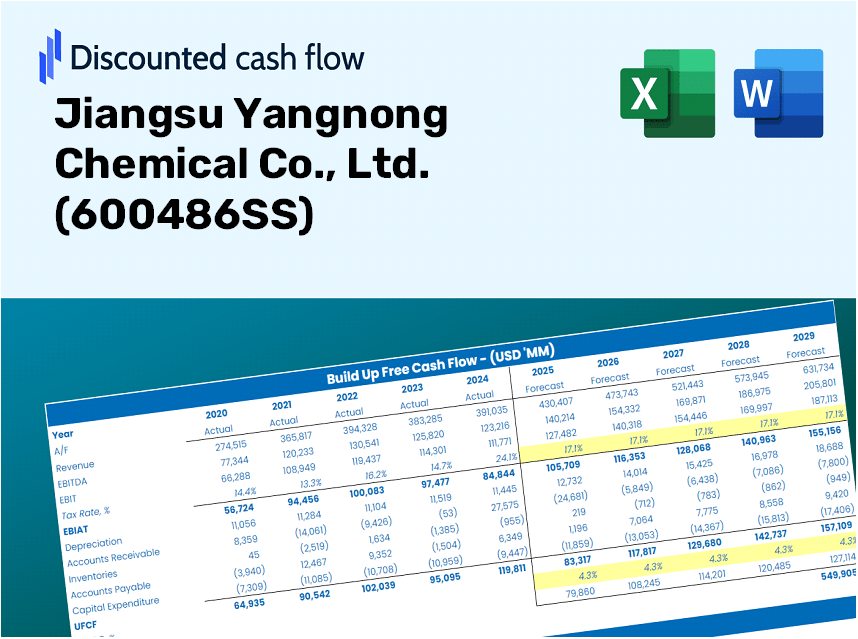
Discounted Cash Flow (DCF) - (USD MM)
| Year | AY1 2020 |
AY2 2021 |
AY3 2022 |
AY4 2023 |
AY5 2024 |
FY1 2025 |
FY2 2026 |
FY3 2027 |
FY4 2028 |
FY5 2029 |
|---|---|---|---|---|---|---|---|---|---|---|
| Revenue | 9,831.2 | 11,841.5 | 15,810.8 | 11,477.7 | 10,434.8 | 10,872.4 | 11,328.4 | 11,803.5 | 12,298.6 | 12,814.4 |
| Revenue Growth, % | 0 | 20.45 | 33.52 | -27.41 | -9.09 | 4.19 | 4.19 | 4.19 | 4.19 | 4.19 |
| EBITDA | 1,863.8 | 2,068.2 | 2,836.5 | 2,671.5 | 2,189.9 | 2,144.6 | 2,234.6 | 2,328.3 | 2,425.9 | 2,527.7 |
| EBITDA, % | 18.96 | 17.47 | 17.94 | 23.28 | 20.99 | 19.73 | 19.73 | 19.73 | 19.73 | 19.73 |
| Depreciation | 393.0 | 578.5 | 642.3 | 755.4 | 719.4 | 574.5 | 598.6 | 623.7 | 649.9 | 677.1 |
| Depreciation, % | 4 | 4.89 | 4.06 | 6.58 | 6.89 | 5.28 | 5.28 | 5.28 | 5.28 | 5.28 |
| EBIT | 1,470.8 | 1,489.7 | 2,194.1 | 1,916.1 | 1,470.5 | 1,570.1 | 1,635.9 | 1,704.5 | 1,776.0 | 1,850.5 |
| EBIT, % | 14.96 | 12.58 | 13.88 | 16.69 | 14.09 | 14.44 | 14.44 | 14.44 | 14.44 | 14.44 |
| Total Cash | 1,891.4 | 2,271.7 | 3,357.9 | 3,713.0 | 1,618.0 | 2,337.9 | 2,436.0 | 2,538.2 | 2,644.6 | 2,755.5 |
| Total Cash, percent | .0 | .0 | .0 | .0 | .0 | .0 | .0 | .0 | .0 | .0 |
| Account Receivables | 1,882.7 | 2,917.4 | 3,405.1 | 3,332.7 | 3,556.1 | 2,792.9 | 2,910.0 | 3,032.1 | 3,159.3 | 3,291.8 |
| Account Receivables, % | 19.15 | 24.64 | 21.54 | 29.04 | 34.08 | 25.69 | 25.69 | 25.69 | 25.69 | 25.69 |
| Inventories | 1,631.6 | 1,866.5 | 2,084.5 | 1,589.8 | 1,104.9 | 1,521.8 | 1,585.6 | 1,652.1 | 1,721.4 | 1,793.6 |
| Inventories, % | 16.6 | 15.76 | 13.18 | 13.85 | 10.59 | 14 | 14 | 14 | 14 | 14 |
| Accounts Payable | 2,694.7 | 2,487.3 | 2,340.4 | 3,707.9 | 4,462.9 | 3,007.2 | 3,133.3 | 3,264.7 | 3,401.6 | 3,544.3 |
| Accounts Payable, % | 27.41 | 21.01 | 14.8 | 32.31 | 42.77 | 27.66 | 27.66 | 27.66 | 27.66 | 27.66 |
| Capital Expenditure | -1,162.3 | -1,331.7 | -1,167.3 | -1,518.0 | -1,835.2 | -1,332.2 | -1,388.0 | -1,446.3 | -1,506.9 | -1,570.1 |
| Capital Expenditure, % | -11.82 | -11.25 | -7.38 | -13.23 | -17.59 | -12.25 | -12.25 | -12.25 | -12.25 | -12.25 |
| Tax Rate, % | 14.51 | 14.51 | 14.51 | 14.51 | 14.51 | 14.51 | 14.51 | 14.51 | 14.51 | 14.51 |
| EBITAT | 1,253.4 | 1,263.8 | 1,843.6 | 1,606.9 | 1,257.1 | 1,329.6 | 1,385.4 | 1,443.5 | 1,504.1 | 1,567.1 |
| Depreciation | ||||||||||
| Changes in Account Receivables | ||||||||||
| Changes in Inventories | ||||||||||
| Changes in Accounts Payable | ||||||||||
| Capital Expenditure | ||||||||||
| UFCF | -335.6 | -966.3 | 466.0 | 2,778.9 | 1,158.0 | -537.5 | 541.1 | 563.8 | 587.5 | 612.1 |
| WACC, % | 8.02 | 8.02 | 8.01 | 8.01 | 8.02 | 8.02 | 8.02 | 8.02 | 8.02 | 8.02 |
| PV UFCF | ||||||||||
| SUM PV UFCF | 1,261.4 | |||||||||
| Long Term Growth Rate, % | 2.00 | |||||||||
| Free cash flow (T + 1) | 624 | |||||||||
| Terminal Value | 10,378 | |||||||||
| Present Terminal Value | 7,058 | |||||||||
| Enterprise Value | 8,319 | |||||||||
| Net Debt | -425 | |||||||||
| Equity Value | 8,744 | |||||||||
| Diluted Shares Outstanding, MM | 404 | |||||||||
| Equity Value Per Share | 21.66 |
What You Will Receive
- Pre-Filled Financial Model: Utilize Jiangsu Yangnong Chemical Co., Ltd.'s actual data for accurate DCF valuation.
- Comprehensive Forecast Control: Modify revenue growth, profit margins, WACC, and other essential variables.
- Real-Time Calculations: Instant updates provide immediate feedback as you adjust inputs.
- Professional-Grade Template: A polished Excel file crafted for high-quality valuation.
- Flexible and Reusable: Designed for customization, allowing for multiple uses in detailed forecasting.
Key Features
- Real-Life 600486SS Data: Equipped with Jiangsu Yangnong Chemical’s historical financial data and future projections.
- Fully Customizable Inputs: Modify revenue growth rates, profit margins, discount rates, tax percentages, and capital investment plans.
- Dynamic Valuation Model: Automatically updates Net Present Value (NPV) and intrinsic value based on your tailored inputs.
- Scenario Testing: Develop multiple forecasting scenarios to evaluate various valuation possibilities.
- User-Friendly Design: Intuitive, organized, and crafted for both seasoned professionals and newcomers.
How It Functions
- Step 1: Download the Excel file.
- Step 2: Examine the pre-filled data for Jiangsu Yangnong Chemical Co., Ltd. (600486SS) (historical and forecasted).
- Step 3: Modify the key assumptions (highlighted in yellow) according to your analysis.
- Step 4: Observe the automatic recalculations reflecting Jiangsu Yangnong's intrinsic value.
- Step 5: Utilize the results for making investment decisions or for reporting purposes.
Why Choose This Calculator for Jiangsu Yangnong Chemical Co., Ltd. (600486SS)?
- Designed for Experts: A sophisticated tool utilized by analysts, CFOs, and industry consultants.
- Accurate Data: Preloaded historical and projected financials for Jiangsu Yangnong Chemical ensure precision.
- Versatile Scenario Analysis: Easily simulate various forecasts and assumptions.
- Comprehensive Outputs: Automatically calculates intrinsic value, NPV, and other essential metrics.
- User-Friendly: Step-by-step guidance simplifies the entire process.
Who Can Benefit from This Product?
- Investors: Make informed decisions with a sophisticated valuation tool tailored for market insights on Jiangsu Yangnong Chemical Co., Ltd. (600486SS).
- Financial Analysts: Streamline your workflow with a customizable DCF model specifically designed for analyzing Jiangsu Yangnong Chemical Co., Ltd. (600486SS).
- Consultants: Effortlessly modify the template for client presentations or detailed reports related to Jiangsu Yangnong Chemical Co., Ltd. (600486SS).
- Finance Enthusiasts: Enhance your grasp of valuation methods through practical, real-world examples from Jiangsu Yangnong Chemical Co., Ltd. (600486SS).
- Educators and Students: Utilize this tool as a hands-on resource for finance courses focusing on Jiangsu Yangnong Chemical Co., Ltd. (600486SS).
Contents of the Template
- Historical Data: Features Jiangsu Yangnong Chemical Co., Ltd.'s past financial performance and baseline projections.
- DCF and Levered DCF Models: Comprehensive templates for calculating the intrinsic value of Jiangsu Yangnong Chemical Co., Ltd. (600486SS).
- WACC Sheet: Pre-configured calculations for the Weighted Average Cost of Capital.
- Editable Inputs: Customize essential factors such as growth rates, EBITDA percentages, and CAPEX assumptions.
- Quarterly and Annual Statements: An extensive analysis of Jiangsu Yangnong Chemical Co., Ltd.'s financials.
- Interactive Dashboard: Dynamic visualization of valuation results and future projections.
Disclaimer
All information, articles, and product details provided on this website are for general informational and educational purposes only. We do not claim any ownership over, nor do we intend to infringe upon, any trademarks, copyrights, logos, brand names, or other intellectual property mentioned or depicted on this site. Such intellectual property remains the property of its respective owners, and any references here are made solely for identification or informational purposes, without implying any affiliation, endorsement, or partnership.
We make no representations or warranties, express or implied, regarding the accuracy, completeness, or suitability of any content or products presented. Nothing on this website should be construed as legal, tax, investment, financial, medical, or other professional advice. In addition, no part of this site—including articles or product references—constitutes a solicitation, recommendation, endorsement, advertisement, or offer to buy or sell any securities, franchises, or other financial instruments, particularly in jurisdictions where such activity would be unlawful.
All content is of a general nature and may not address the specific circumstances of any individual or entity. It is not a substitute for professional advice or services. Any actions you take based on the information provided here are strictly at your own risk. You accept full responsibility for any decisions or outcomes arising from your use of this website and agree to release us from any liability in connection with your use of, or reliance upon, the content or products found herein.