
|
Kuaijishan Shaoxing Rice Wine Co., Ltd. (601579.ss) Valoración de DCF |
Completamente Editable: Adáptelo A Sus Necesidades En Excel O Sheets
Diseño Profesional: Plantillas Confiables Y Estándares De La Industria
Predeterminadas Para Un Uso Rápido Y Eficiente
Compatible con MAC / PC, completamente desbloqueado
No Se Necesita Experiencia; Fáciles De Seguir
Kuaijishan Shaoxing Rice Wine Co., Ltd. (601579.SS) Bundle
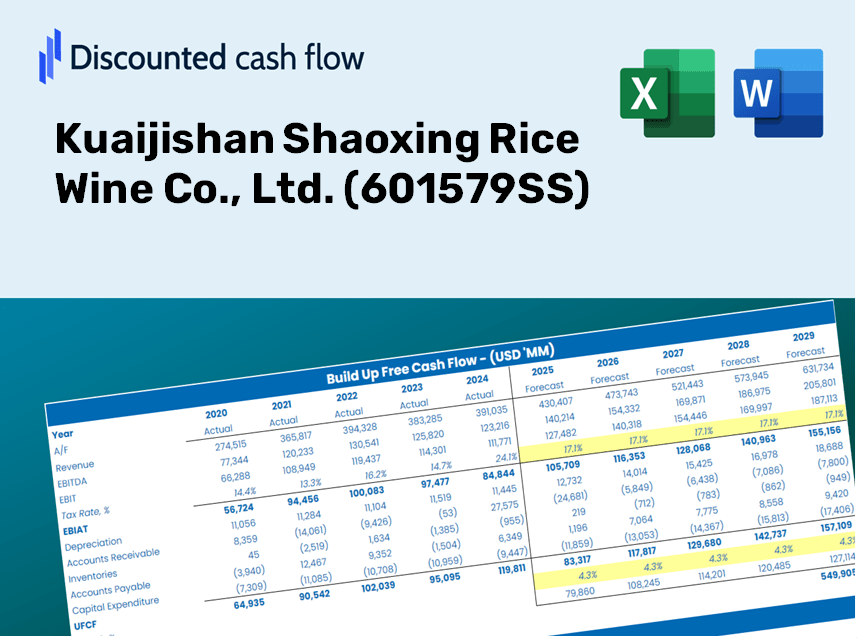
¡Obtenga información sobre su análisis de valoración de Kuaijishan Shaoxing Rice Co., Ltd. (601579SS) utilizando nuestra sofisticada calculadora DCF! Esta plantilla de Excel se precede con datos reales (601579SS), lo que le permite ajustar los pronósticos y supuestos para determinar el valor intrínseco de Kuaijishan Shaoxing Rice Wine Co., Ltd. con precisión.
What You Will Receive
- Actual Kuaijishan Financial Data: Pre-filled with Kuaijishan's historical and forecasted data for accurate analysis.
- Fully Customizable Template: Easily adjust key inputs such as revenue growth, WACC, and EBITDA %.
- Instant Calculations: Witness real-time updates of Kuaijishan's intrinsic value as you make changes.
- Professional Valuation Tool: Crafted for investors, analysts, and consultants in pursuit of reliable DCF outcomes.
- User-Friendly Layout: Simple design and clear guidance suitable for all skill levels.
Key Features
- Comprehensive Valuation Tools: Features detailed DCF models tailored for Kuaijishan Shaoxing Rice Wine Co., Ltd. (601579SS).
- Customizable WACC Calculator: Access a pre-designed Weighted Average Cost of Capital sheet with adjustable parameters.
- Flexible Forecast Assumptions: Easily update growth projections, capital expenditures, and discount rates.
- Integrated Financial Ratios: Evaluate profitability, leverage, and efficiency metrics specific to Kuaijishan Shaoxing Rice Wine Co., Ltd. (601579SS).
- Interactive Dashboard and Visuals: Engaging charts display essential valuation metrics for straightforward analysis.
How It Works
- 1. Open the Template: Download and open the Excel file containing Kuaijishan Shaoxing Rice Wine Co., Ltd.'s (601579SS) pre-loaded data.
- 2. Edit Assumptions: Adjust key inputs such as growth rates, WACC, and capital expenditures as needed.
- 3. View Results Instantly: The DCF model will automatically calculate the intrinsic value and NPV for you.
- 4. Test Scenarios: Evaluate various forecasts to explore different valuation outcomes.
- 5. Use with Confidence: Share professional valuation insights to enhance your decision-making process.
Why Opt for Kuaijishan Shaoxing Rice Wine Co., Ltd. (601579SS)?
- User-Friendly Design: Perfect for both novices and seasoned users.
- Customizable Inputs: Adjust parameters easily to fit your specific analysis.
- Real-Time Feedback: Observe immediate changes to Kuaijishan's valuation as you modify inputs.
- Preloaded Data: Comes with Kuaijishan's actual financial information for swift assessments.
- Professionally Endorsed: Widely used by investors and analysts for making informed decisions.
Who Should Utilize This Product?
- Individual Investors: Make well-informed decisions about buying or selling shares of Kuaijishan Shaoxing Rice Wine Co., Ltd. (601579SS).
- Financial Analysts: Enhance valuation processes with pre-built financial models tailored for Kuaijishan Shaoxing Rice Wine Co., Ltd. (601579SS).
- Consultants: Provide accurate and timely valuation insights regarding Kuaijishan Shaoxing Rice Wine Co., Ltd. (601579SS) to your clients.
- Business Owners: Gain valuable insights into how companies like Kuaijishan Shaoxing Rice Wine Co., Ltd. (601579SS) are valued to inform your strategic decisions.
- Finance Students: Explore valuation methodologies using real-world data and case studies related to Kuaijishan Shaoxing Rice Wine Co., Ltd. (601579SS).
Contents of the Template
- Historical Data: Comprehensive overview of Kuaijishan Shaoxing Rice Wine Co., Ltd.'s past financial performance and baseline forecasts.
- DCF and Levered DCF Models: In-depth templates to estimate the intrinsic value of Kuaijishan Shaoxing Rice Wine Co., Ltd. (601579SS).
- WACC Sheet: Pre-calculated metrics for the Weighted Average Cost of Capital.
- Editable Inputs: Customize essential drivers such as growth rates, EBITDA percentages, and capital expenditure assumptions.
- Quarterly and Annual Statements: Detailed analysis of Kuaijishan Shaoxing Rice Wine Co., Ltd.'s financials.
- Interactive Dashboard: Dynamic visualization of valuation results and forecasts.
Disclaimer
All information, articles, and product details provided on this website are for general informational and educational purposes only. We do not claim any ownership over, nor do we intend to infringe upon, any trademarks, copyrights, logos, brand names, or other intellectual property mentioned or depicted on this site. Such intellectual property remains the property of its respective owners, and any references here are made solely for identification or informational purposes, without implying any affiliation, endorsement, or partnership.
We make no representations or warranties, express or implied, regarding the accuracy, completeness, or suitability of any content or products presented. Nothing on this website should be construed as legal, tax, investment, financial, medical, or other professional advice. In addition, no part of this site—including articles or product references—constitutes a solicitation, recommendation, endorsement, advertisement, or offer to buy or sell any securities, franchises, or other financial instruments, particularly in jurisdictions where such activity would be unlawful.
All content is of a general nature and may not address the specific circumstances of any individual or entity. It is not a substitute for professional advice or services. Any actions you take based on the information provided here are strictly at your own risk. You accept full responsibility for any decisions or outcomes arising from your use of this website and agree to release us from any liability in connection with your use of, or reliance upon, the content or products found herein.