
|
Haier Smart Home Co., Ltd. (6690.HK) Valoración de DCF |
Completamente Editable: Adáptelo A Sus Necesidades En Excel O Sheets
Diseño Profesional: Plantillas Confiables Y Estándares De La Industria
Predeterminadas Para Un Uso Rápido Y Eficiente
Compatible con MAC / PC, completamente desbloqueado
No Se Necesita Experiencia; Fáciles De Seguir
Haier Smart Home Co., Ltd. (6690.HK) Bundle
Ingementada para su precisión, nuestra calculadora DCF (6690HK) le permite evaluar Haier Smart Home Co., Ltd. Valoración utilizando datos financieros del mundo real y ofrece una flexibilidad completa para modificar todos los parámetros esenciales para mejorar las proyecciones.
Benefits You Can Expect
- Pre-Configured Financial Model: Utilize Haier Smart Home's actual data for accurate DCF valuation.
- Comprehensive Forecasting Control: Modify revenue growth, profit margins, WACC, and other critical variables.
- Real-Time Calculations: Automatic updates provide immediate results as you make adjustments.
- Professional-Grade Template: A polished Excel file crafted for high-quality valuation presentations.
- Flexible and Reusable: Designed for adaptability, enabling repeated use for in-depth forecasts.
Key Features
- Pre-Loaded Data: Haier Smart Home’s historical financial reports and pre-filled projections.
- Fully Adjustable Inputs: Modify WACC, tax rates, revenue growth, and EBITDA margins as needed.
- Instant Results: Witness Haier Smart Home’s intrinsic value recalculate in real time.
- Clear Visual Outputs: Dashboard charts illustrate valuation results and essential metrics.
- Built for Accuracy: A professional tool designed for analysts, investors, and finance specialists.
How It Works
- 1. Access the Template: Download and open the Excel file featuring Haier Smart Home Co., Ltd.'s (6690HK) preloaded data.
- 2. Modify Assumptions: Adjust key inputs such as growth rates, WACC, and capital expenditures to suit your analysis.
- 3. View Results Instantly: The DCF model will automatically compute the intrinsic value and NPV based on your inputs.
- 4. Explore Scenarios: Evaluate various forecasts to understand different valuation possibilities.
- 5. Present with Assurance: Deliver professional valuation insights to enhance your decision-making process.
Why Choose This Calculator for Haier Smart Home Co., Ltd. (6690HK)?
- User-Friendly Interface: Perfect for both newcomers and seasoned professionals.
- Customizable Parameters: Adjust inputs effortlessly to tailor your analysis.
- Real-Time Feedback: Observe immediate updates to Haier's valuation as you change inputs.
- Pre-Loaded Financials: Comes with Haier's latest financial data for swift evaluations.
- Endorsed by Financial Experts: A go-to tool for investors and analysts seeking reliable insights.
Who Should Utilize This Product?
- Professional Investors: Create detailed and dependable valuation models for portfolio assessment of Haier Smart Home Co., Ltd. (6690HK).
- Corporate Finance Teams: Evaluate valuation scenarios to inform internal strategies for Haier Smart Home Co., Ltd. (6690HK).
- Consultants and Advisors: Offer clients precise valuation insights regarding Haier Smart Home Co., Ltd. (6690HK).
- Students and Educators: Utilize real-world data to enhance learning and practice in financial modeling with Haier Smart Home Co., Ltd. (6690HK).
- Tech Enthusiasts: Gain insights into how technology companies like Haier Smart Home Co., Ltd. (6690HK) are valued in the market.
Contents of the Template
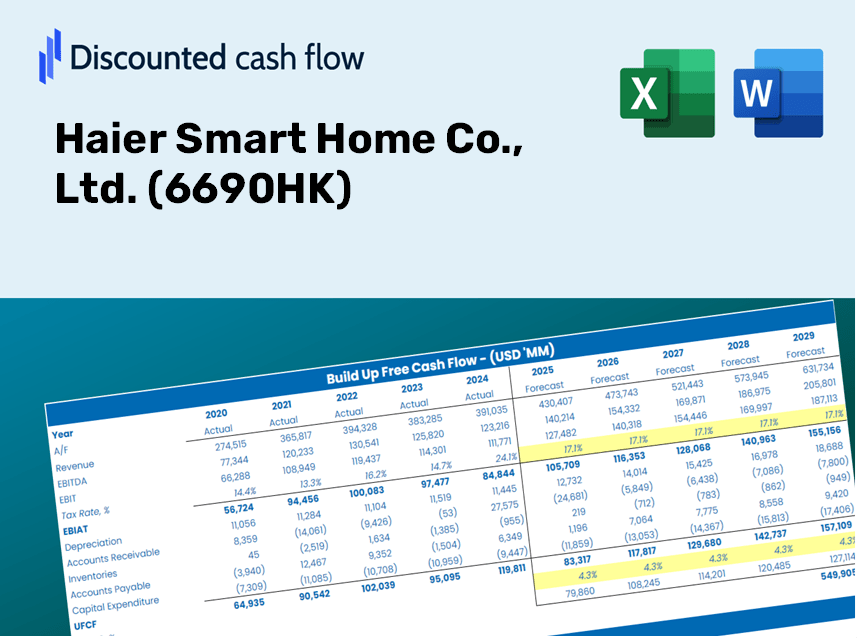
- Operating and Balance Sheet Data: Pre-filled historical data and forecasts for Haier Smart Home Co., Ltd. (6690HK), including revenue, EBITDA, EBIT, and capital expenditures.
- WACC Calculation: A dedicated sheet for computing the Weighted Average Cost of Capital (WACC), encompassing parameters like Beta, risk-free rate, and share price.
- DCF Valuation (Unlevered and Levered): Customizable Discounted Cash Flow models that present intrinsic value with comprehensive calculations.
- Financial Statements: Pre-loaded annual and quarterly financial statements for Haier Smart Home Co., Ltd. (6690HK) to facilitate in-depth analysis.
- Key Ratios: Features profitability, leverage, and efficiency ratios specific to Haier Smart Home Co., Ltd. (6690HK).
- Dashboard and Charts: A visual summary of valuation outputs and key assumptions to simplify results analysis.
Disclaimer
All information, articles, and product details provided on this website are for general informational and educational purposes only. We do not claim any ownership over, nor do we intend to infringe upon, any trademarks, copyrights, logos, brand names, or other intellectual property mentioned or depicted on this site. Such intellectual property remains the property of its respective owners, and any references here are made solely for identification or informational purposes, without implying any affiliation, endorsement, or partnership.
We make no representations or warranties, express or implied, regarding the accuracy, completeness, or suitability of any content or products presented. Nothing on this website should be construed as legal, tax, investment, financial, medical, or other professional advice. In addition, no part of this site—including articles or product references—constitutes a solicitation, recommendation, endorsement, advertisement, or offer to buy or sell any securities, franchises, or other financial instruments, particularly in jurisdictions where such activity would be unlawful.
All content is of a general nature and may not address the specific circumstances of any individual or entity. It is not a substitute for professional advice or services. Any actions you take based on the information provided here are strictly at your own risk. You accept full responsibility for any decisions or outcomes arising from your use of this website and agree to release us from any liability in connection with your use of, or reliance upon, the content or products found herein.