
|
Valoración de DCF Smoore International Holdings Limited (6969.HK) |
Completamente Editable: Adáptelo A Sus Necesidades En Excel O Sheets
Diseño Profesional: Plantillas Confiables Y Estándares De La Industria
Predeterminadas Para Un Uso Rápido Y Eficiente
Compatible con MAC / PC, completamente desbloqueado
No Se Necesita Experiencia; Fáciles De Seguir
Smoore International Holdings Limited (6969.HK) Bundle
¡Descubra el verdadero potencial de Smoore International Holdings Limited con nuestra calculadora DCF de grado profesional! Ajuste los supuestos clave, explore varios escenarios y evalúe cómo los cambios afectan la valoración de Smoore International Holdings Limited, todo dentro de una sola plantilla de Excel.
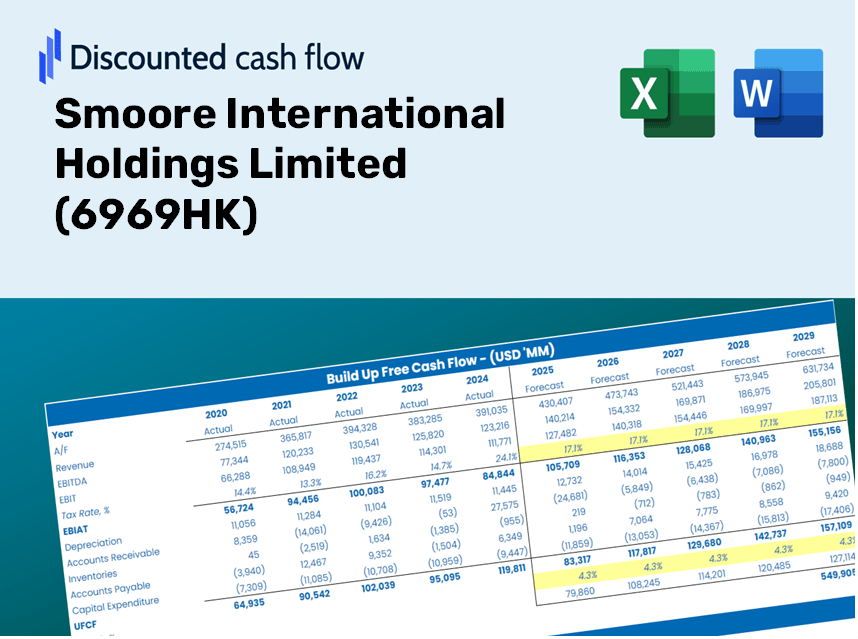
Discounted Cash Flow (DCF) - (USD MM)
| Year | AY1 2020 |
AY2 2021 |
AY3 2022 |
AY4 2023 |
AY5 2024 |
FY1 2025 |
FY2 2026 |
FY3 2027 |
FY4 2028 |
FY5 2029 |
|---|---|---|---|---|---|---|---|---|---|---|
| Revenue | 10,936.7 | 15,028.8 | 13,269.4 | 12,202.5 | 12,891.0 | 13,642.3 | 14,437.4 | 15,278.8 | 16,169.2 | 17,111.5 |
| Revenue Growth, % | 0 | 37.42 | -11.71 | -8.04 | 5.64 | 5.83 | 5.83 | 5.83 | 5.83 | 5.83 |
| EBITDA | 4,485.3 | 6,279.9 | 2,818.6 | 2,442.1 | 1,173.6 | 3,633.1 | 3,844.8 | 4,068.9 | 4,306.1 | 4,557.0 |
| EBITDA, % | 41.01 | 41.79 | 21.24 | 20.01 | 9.1 | 26.63 | 26.63 | 26.63 | 26.63 | 26.63 |
| Depreciation | 61.4 | 95.9 | 242.6 | 296.6 | 96.6 | 169.4 | 179.2 | 189.7 | 200.7 | 212.4 |
| Depreciation, % | 0.56151 | 0.63786 | 1.83 | 2.43 | 0.74974 | 1.24 | 1.24 | 1.24 | 1.24 | 1.24 |
| EBIT | 4,423.9 | 6,184.0 | 2,576.0 | 2,145.5 | 1,077.0 | 3,463.7 | 3,665.6 | 3,879.2 | 4,105.3 | 4,344.6 |
| EBIT, % | 40.45 | 41.15 | 19.41 | 17.58 | 8.35 | 25.39 | 25.39 | 25.39 | 25.39 | 25.39 |
| Total Cash | 10,442.7 | 16,019.9 | 16,601.3 | 17,664.9 | 13,646.7 | 13,519.1 | 14,307.0 | 15,140.8 | 16,023.1 | 16,957.0 |
| Total Cash, percent | .0 | .0 | .0 | .0 | .0 | .0 | .0 | .0 | .0 | .0 |
| Account Receivables | 2,422.9 | 2,632.3 | 2,514.7 | 2,063.0 | 2,277.9 | 2,542.8 | 2,691.0 | 2,847.9 | 3,013.8 | 3,189.5 |
| Account Receivables, % | 22.15 | 17.52 | 18.95 | 16.91 | 17.67 | 18.64 | 18.64 | 18.64 | 18.64 | 18.64 |
| Inventories | 479.5 | 611.9 | 918.4 | 853.5 | 994.7 | 820.9 | 868.8 | 919.4 | 973.0 | 1,029.7 |
| Inventories, % | 4.38 | 4.07 | 6.92 | 6.99 | 7.72 | 6.02 | 6.02 | 6.02 | 6.02 | 6.02 |
| Accounts Payable | 767.3 | 903.3 | 1,256.7 | 1,387.4 | 1,496.4 | 1,240.8 | 1,313.1 | 1,389.6 | 1,470.6 | 1,556.3 |
| Accounts Payable, % | 7.02 | 6.01 | 9.47 | 11.37 | 11.61 | 9.1 | 9.1 | 9.1 | 9.1 | 9.1 |
| Capital Expenditure | -422.9 | -2,161.2 | -1,851.7 | -1,345.4 | -1,131.7 | -1,419.0 | -1,501.7 | -1,589.2 | -1,681.8 | -1,779.8 |
| Capital Expenditure, % | -3.87 | -14.38 | -13.95 | -11.03 | -8.78 | -10.4 | -10.4 | -10.4 | -10.4 | -10.4 |
| Tax Rate, % | 21.26 | 21.26 | 21.26 | 21.26 | 21.26 | 21.26 | 21.26 | 21.26 | 21.26 | 21.26 |
| EBITAT | 3,405.3 | 5,265.4 | 2,188.8 | 1,822.6 | 848.1 | 2,845.7 | 3,011.6 | 3,187.1 | 3,372.8 | 3,569.4 |
| Depreciation | ||||||||||
| Changes in Account Receivables | ||||||||||
| Changes in Inventories | ||||||||||
| Changes in Accounts Payable | ||||||||||
| Capital Expenditure | ||||||||||
| UFCF | 908.9 | 2,994.2 | 744.2 | 1,421.0 | -433.9 | 1,249.3 | 1,565.4 | 1,656.6 | 1,753.2 | 1,855.4 |
| WACC, % | 8.97 | 8.98 | 8.98 | 8.98 | 8.97 | 8.98 | 8.98 | 8.98 | 8.98 | 8.98 |
| PV UFCF | ||||||||||
| SUM PV UFCF | 6,194.8 | |||||||||
| Long Term Growth Rate, % | 2.00 | |||||||||
| Free cash flow (T + 1) | 1,892 | |||||||||
| Terminal Value | 27,126 | |||||||||
| Present Terminal Value | 17,649 | |||||||||
| Enterprise Value | 23,844 | |||||||||
| Net Debt | -3,595 | |||||||||
| Equity Value | 27,439 | |||||||||
| Diluted Shares Outstanding, MM | 6,143 | |||||||||
| Equity Value Per Share | 4.47 |
What You Will Receive
- Authentic Smoore Data: Comprehensive financials – encompassing revenue to EBIT – derived from real and forecasted figures.
- Complete Customization: Modify all essential parameters (yellow cells) such as WACC, growth %, and tax rates.
- Immediate Valuation Adjustments: Automatic updates to assess the influence of changes on Smoore's fair value.
- Flexible Excel Template: Designed for easy edits, scenario analysis, and in-depth projections.
- Efficient and Precise: Avoid starting from scratch while ensuring accuracy and adaptability.
Essential Features
- Genuine Smoore Financial Data: Access reliable pre-loaded historical data and future predictions.
- Adjustable Forecast Parameters: Modify yellow-highlighted fields such as WACC, growth rates, and profit margins.
- Real-Time Calculations: Automatic updates for DCF, Net Present Value (NPV), and cash flow assessments.
- Interactive Dashboard: Clear charts and summaries to visualize your valuation outcomes.
- Suitable for All Levels: A user-friendly design tailored for investors, CFOs, and consultants alike.
How It Works
- Download: Obtain the ready-to-use Excel file containing Smoore International Holdings Limited's (6969HK) financial data.
- Customize: Modify forecasts, such as revenue growth, EBITDA %, and WACC as per your requirements.
- Update Automatically: Real-time updates for intrinsic value and NPV calculations provide immediate insights.
- Test Scenarios: Generate various projections and instantly compare the outcomes.
- Make Decisions: Leverage the valuation results to inform your investment strategy.
Why Choose This Calculator for Smoore International Holdings Limited (6969HK)?
- Accurate Data: Up-to-date financial information for Smoore ensures dependable valuation outcomes.
- Customizable: Modify essential parameters such as growth rates, WACC, and tax rates to fit your financial forecasts.
- Time-Saving: Ready-to-use calculations save you from starting from scratch.
- Professional-Grade Tool: Tailored for investors, analysts, and consultants focusing on Smoore.
- User-Friendly: An intuitive design and clear instructions make it accessible for all users.
Who Should Consider This Product?
- Investors: Accurately assess the fair value of Smoore International Holdings Limited (6969HK) before making investment choices.
- CFOs: Utilize a professional-grade DCF model for financial reporting and analysis related to Smoore International Holdings Limited (6969HK).
- Consultants: Easily customize the template for valuation reports concerning clients in relation to Smoore International Holdings Limited (6969HK).
- Entrepreneurs: Acquire insights into the financial modeling strategies employed by leading firms, including Smoore International Holdings Limited (6969HK).
- Educators: Implement it as a teaching resource to illustrate valuation methodologies using Smoore International Holdings Limited (6969HK) as a case study.
Contents of the Template
- Comprehensive DCF Model: Editable template featuring detailed valuation calculations.
- Real-World Data: Smoore International Holdings Limited’s historical and projected financials preloaded for analysis.
- Customizable Parameters: Modify WACC, growth rates, and tax assumptions to explore various scenarios.
- Financial Statements: Complete annual and quarterly breakdowns for thorough insights.
- Key Ratios: Integrated analysis focusing on profitability, efficiency, and leverage metrics.
- Dashboard with Visual Outputs: Charts and tables providing clear, actionable results.
Disclaimer
All information, articles, and product details provided on this website are for general informational and educational purposes only. We do not claim any ownership over, nor do we intend to infringe upon, any trademarks, copyrights, logos, brand names, or other intellectual property mentioned or depicted on this site. Such intellectual property remains the property of its respective owners, and any references here are made solely for identification or informational purposes, without implying any affiliation, endorsement, or partnership.
We make no representations or warranties, express or implied, regarding the accuracy, completeness, or suitability of any content or products presented. Nothing on this website should be construed as legal, tax, investment, financial, medical, or other professional advice. In addition, no part of this site—including articles or product references—constitutes a solicitation, recommendation, endorsement, advertisement, or offer to buy or sell any securities, franchises, or other financial instruments, particularly in jurisdictions where such activity would be unlawful.
All content is of a general nature and may not address the specific circumstances of any individual or entity. It is not a substitute for professional advice or services. Any actions you take based on the information provided here are strictly at your own risk. You accept full responsibility for any decisions or outcomes arising from your use of this website and agree to release us from any liability in connection with your use of, or reliance upon, the content or products found herein.