
|
Shimamura Co., Ltd. (8227.T) Valoración de DCF |
Completamente Editable: Adáptelo A Sus Necesidades En Excel O Sheets
Diseño Profesional: Plantillas Confiables Y Estándares De La Industria
Predeterminadas Para Un Uso Rápido Y Eficiente
Compatible con MAC / PC, completamente desbloqueado
No Se Necesita Experiencia; Fáciles De Seguir
SHIMAMURA Co., Ltd. (8227.T) Bundle
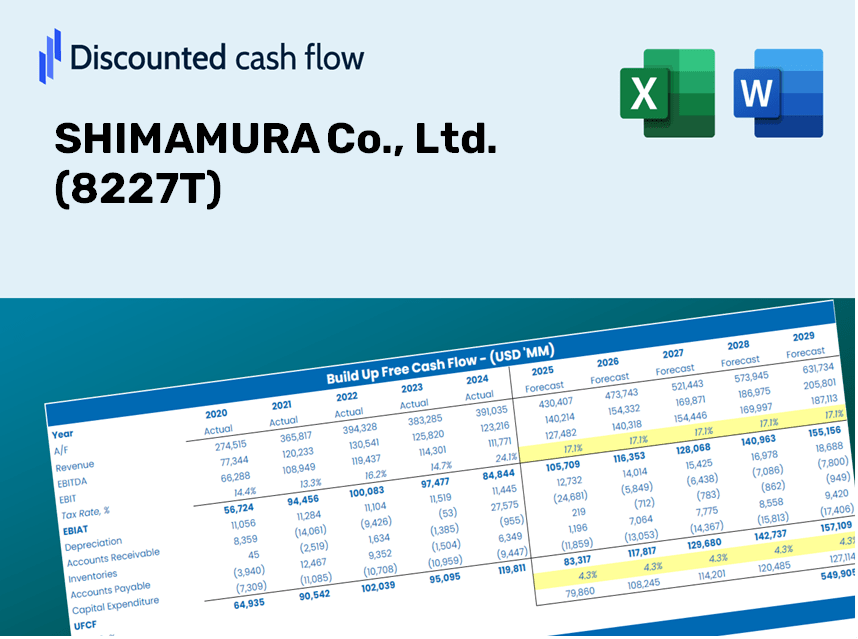
¿Busca determinar el valor intrínseco de Shimamura Co., Ltd.? Nuestra calculadora DCF (8227T) integra datos de la vida real junto con extensas funciones de personalización, lo que le permite ajustar los pronósticos y mejorar sus estrategias de inversión.
Discounted Cash Flow (DCF) - (USD MM)
| Year | AY1 2021 |
AY2 2022 |
AY3 2023 |
AY4 2024 |
AY5 2025 |
FY1 2026 |
FY2 2027 |
FY3 2028 |
FY4 2029 |
FY5 2030 |
|---|---|---|---|---|---|---|---|---|---|---|
| Revenue | 543,560.0 | 584,771.0 | 617,519.0 | 636,499.0 | 666,742.0 | 701,757.4 | 738,611.7 | 777,401.6 | 818,228.5 | 861,199.6 |
| Revenue Growth, % | 0 | 7.58 | 5.6 | 3.07 | 4.75 | 5.25 | 5.25 | 5.25 | 5.25 | 5.25 |
| EBITDA | 43,498.0 | 55,332.0 | 59,193.0 | 61,226.0 | 65,345.0 | 65,221.4 | 68,646.6 | 72,251.8 | 76,046.2 | 80,039.9 |
| EBITDA, % | 8 | 9.46 | 9.59 | 9.62 | 9.8 | 9.29 | 9.29 | 9.29 | 9.29 | 9.29 |
| Depreciation | 5,471.0 | 5,911.0 | 5,891.0 | 5,918.0 | 6,105.0 | 6,760.4 | 7,115.4 | 7,489.1 | 7,882.4 | 8,296.3 |
| Depreciation, % | 1.01 | 1.01 | 0.95398 | 0.92977 | 0.91565 | 0.96335 | 0.96335 | 0.96335 | 0.96335 | 0.96335 |
| EBIT | 38,027.0 | 49,421.0 | 53,302.0 | 55,308.0 | 59,240.0 | 58,461.0 | 61,531.2 | 64,762.7 | 68,163.8 | 71,743.6 |
| EBIT, % | 7 | 8.45 | 8.63 | 8.69 | 8.88 | 8.33 | 8.33 | 8.33 | 8.33 | 8.33 |
| Total Cash | 211,486.0 | 234,427.0 | 263,157.0 | 270,835.0 | 296,995.0 | 292,922.5 | 308,306.0 | 324,497.4 | 341,539.1 | 359,475.7 |
| Total Cash, percent | .0 | .0 | .0 | .0 | .0 | .0 | .0 | .0 | .0 | .0 |
| Account Receivables | 6,622.0 | 8,509.0 | 10,217.0 | 12,349.0 | 13,726.0 | 11,686.6 | 12,300.4 | 12,946.4 | 13,626.3 | 14,341.9 |
| Account Receivables, % | 1.22 | 1.46 | 1.65 | 1.94 | 2.06 | 1.67 | 1.67 | 1.67 | 1.67 | 1.67 |
| Inventories | 50,612.0 | 52,599.0 | 54,266.0 | 57,146.0 | 56,829.0 | 62,590.2 | 65,877.3 | 69,336.9 | 72,978.3 | 76,810.9 |
| Inventories, % | 9.31 | 8.99 | 8.79 | 8.98 | 8.52 | 8.92 | 8.92 | 8.92 | 8.92 | 8.92 |
| Accounts Payable | 24,024.0 | 28,425.0 | 24,285.0 | 24,625.0 | 24,066.0 | 29,041.0 | 30,566.1 | 32,171.4 | 33,860.9 | 35,639.2 |
| Accounts Payable, % | 4.42 | 4.86 | 3.93 | 3.87 | 3.61 | 4.14 | 4.14 | 4.14 | 4.14 | 4.14 |
| Capital Expenditure | -8,280.0 | -8,248.0 | -4,384.0 | -7,636.0 | -11,665.0 | -9,253.3 | -9,739.2 | -10,250.7 | -10,789.1 | -11,355.7 |
| Capital Expenditure, % | -1.52 | -1.41 | -0.70994 | -1.2 | -1.75 | -1.32 | -1.32 | -1.32 | -1.32 | -1.32 |
| Tax Rate, % | 29.51 | 29.51 | 29.51 | 29.51 | 29.51 | 29.51 | 29.51 | 29.51 | 29.51 | 29.51 |
| EBITAT | 25,877.9 | 34,861.6 | 37,782.8 | 39,915.1 | 41,759.5 | 41,172.5 | 43,334.8 | 45,610.6 | 48,006.0 | 50,527.1 |
| Depreciation | ||||||||||
| Changes in Account Receivables | ||||||||||
| Changes in Inventories | ||||||||||
| Changes in Accounts Payable | ||||||||||
| Capital Expenditure | ||||||||||
| UFCF | -10,141.1 | 33,051.6 | 31,774.8 | 33,525.1 | 34,580.5 | 39,932.8 | 38,335.3 | 40,348.6 | 42,467.6 | 44,697.8 |
| WACC, % | 4.68 | 4.68 | 4.68 | 4.68 | 4.68 | 4.68 | 4.68 | 4.68 | 4.68 | 4.68 |
| PV UFCF | ||||||||||
| SUM PV UFCF | 179,214.3 | |||||||||
| Long Term Growth Rate, % | 0.50 | |||||||||
| Free cash flow (T + 1) | 44,921 | |||||||||
| Terminal Value | 1,073,645 | |||||||||
| Present Terminal Value | 854,003 | |||||||||
| Enterprise Value | 1,033,217 | |||||||||
| Net Debt | -161,200 | |||||||||
| Equity Value | 1,194,417 | |||||||||
| Diluted Shares Outstanding, MM | 74 | |||||||||
| Equity Value Per Share | 16,249.69 |
What You Will Receive
- Authentic SHIMAMURA Data: Preloaded financial metrics – from sales to EBIT – based on verified and projected figures.
- Comprehensive Customization: Modify all essential parameters (yellow cells) such as WACC, growth %, and tax rates.
- Real-Time Valuation Updates: Automatic recalculations to assess the effects of changes on SHIMAMURA’s fair value.
- Flexible Excel Template: Designed for quick modifications, scenario analysis, and thorough projections.
- Efficient and Precise: Avoid building models from the ground up while ensuring accuracy and adaptability.
Key Features
- Customizable Financial Inputs: Adjust vital metrics such as sales growth, operating margin, and capital expenditures.
- Instant DCF Valuation: Quickly computes intrinsic value, NPV, and additional financial metrics.
- High-Precision Accuracy: Utilizes SHIMAMURA Co., Ltd.'s (8227T) actual financial data for reliable valuation results.
- Simplified Scenario Analysis: Effortlessly evaluate various assumptions and analyze results.
- Efficiency Booster: Remove the hassle of constructing detailed valuation models from the ground up.
How It Works
- Download: Obtain the pre-prepared Excel file containing SHIMAMURA Co., Ltd.'s (8227T) financial data.
- Customize: Modify projections, such as sales growth, EBITDA percentage, and WACC.
- Update Automatically: The intrinsic value and NPV calculations refresh in real-time.
- Test Scenarios: Generate various forecasts and instantly compare results.
- Make Decisions: Leverage the valuation findings to inform your investment approach.
Why Choose SHIMAMURA's Financial Calculator?
- Save Time: Skip the hassle of building a DCF model from the ground up—it’s ready for immediate use.
- Enhance Accuracy: Dependable financial data and formulas minimize valuation errors.
- Completely Customizable: Adjust the model to align with your specific assumptions and forecasts.
- User-Friendly: Intuitive charts and outputs ensure straightforward analysis of results.
- Endorsed by Professionals: Crafted for experts who prioritize accuracy and ease of use.
Who Can Benefit from SHIMAMURA Co., Ltd. ([8227T])?
- Investors: Make informed decisions with access to a robust valuation tool tailored for SHIMAMURA Co., Ltd. ([8227T]).
- Financial Analysts: Streamline your workflow with a customizable DCF model specifically designed for SHIMAMURA Co., Ltd. ([8227T]).
- Consultants: Effortlessly modify the template for impactful client presentations and reports focusing on SHIMAMURA Co., Ltd. ([8227T]).
- Finance Enthusiasts: Expand your knowledge of valuation methods through practical examples related to SHIMAMURA Co., Ltd. ([8227T]).
- Educators and Students: Incorporate this tool into finance curricula for hands-on learning about SHIMAMURA Co., Ltd. ([8227T]).
Contents of the Template
- Pre-Filled DCF Model: SHIMAMURA Co., Ltd.'s financial data ready for instant application.
- WACC Calculator: Comprehensive calculations for the Weighted Average Cost of Capital.
- Financial Ratios: Analyze SHIMAMURA's profitability, leverage, and operational efficiency.
- Editable Inputs: Modify assumptions such as growth rates, profit margins, and CAPEX to suit your specific scenarios.
- Financial Statements: Access annual and quarterly reports for in-depth analysis.
- Interactive Dashboard: Effortlessly visualize key valuation metrics and outcomes.
Disclaimer
All information, articles, and product details provided on this website are for general informational and educational purposes only. We do not claim any ownership over, nor do we intend to infringe upon, any trademarks, copyrights, logos, brand names, or other intellectual property mentioned or depicted on this site. Such intellectual property remains the property of its respective owners, and any references here are made solely for identification or informational purposes, without implying any affiliation, endorsement, or partnership.
We make no representations or warranties, express or implied, regarding the accuracy, completeness, or suitability of any content or products presented. Nothing on this website should be construed as legal, tax, investment, financial, medical, or other professional advice. In addition, no part of this site—including articles or product references—constitutes a solicitation, recommendation, endorsement, advertisement, or offer to buy or sell any securities, franchises, or other financial instruments, particularly in jurisdictions where such activity would be unlawful.
All content is of a general nature and may not address the specific circumstances of any individual or entity. It is not a substitute for professional advice or services. Any actions you take based on the information provided here are strictly at your own risk. You accept full responsibility for any decisions or outcomes arising from your use of this website and agree to release us from any liability in connection with your use of, or reliance upon, the content or products found herein.