
|
Kiyo Bank, Ltd. (8370.T) Valoración de DCF |
Completamente Editable: Adáptelo A Sus Necesidades En Excel O Sheets
Diseño Profesional: Plantillas Confiables Y Estándares De La Industria
Predeterminadas Para Un Uso Rápido Y Eficiente
Compatible con MAC / PC, completamente desbloqueado
No Se Necesita Experiencia; Fáciles De Seguir
The Kiyo Bank, Ltd. (8370.T) Bundle
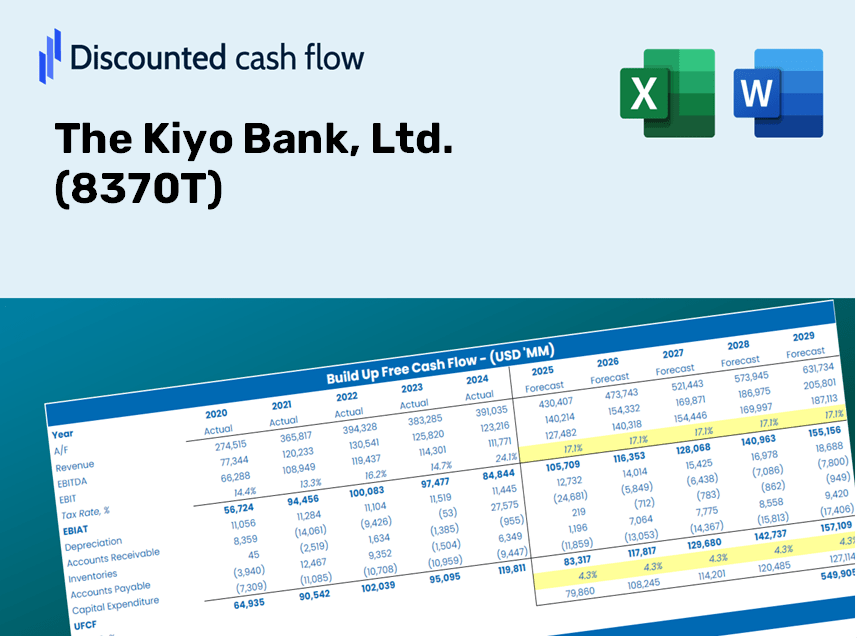
Como inversionista o analista, la calculadora DCF para Kiyo Bank, Ltd. (8370T) es su recurso favorito para una valoración precisa. Equipado con datos reales del banco Kiyo, puede ajustar las previsiones y observar instantáneamente los resultados.
Discounted Cash Flow (DCF) - (USD MM)
| Year | AY1 2020 |
AY2 2021 |
AY3 2022 |
AY4 2023 |
AY5 2024 |
FY1 2025 |
FY2 2026 |
FY3 2027 |
FY4 2028 |
FY5 2029 |
|---|---|---|---|---|---|---|---|---|---|---|
| Revenue | 72,313.0 | 75,186.0 | 77,278.0 | 68,251.0 | 86,397.0 | 91,075.7 | 96,007.8 | 101,206.9 | 106,687.6 | 112,465.1 |
| Revenue Growth, % | 0 | 3.97 | 2.78 | -11.68 | 26.59 | 5.42 | 5.42 | 5.42 | 5.42 | 5.42 |
| EBITDA | 20,336.0 | 26,757.0 | 7,454.0 | 22,916.0 | 26,504.0 | 25,065.6 | 26,423.0 | 27,853.9 | 29,362.3 | 30,952.4 |
| EBITDA, % | 28.12 | 35.59 | 9.65 | 33.58 | 30.68 | 27.52 | 27.52 | 27.52 | 27.52 | 27.52 |
| Depreciation | .0 | 2,664.0 | 2,584.0 | 2,882.0 | 3,222.0 | 2,702.9 | 2,849.3 | 3,003.6 | 3,166.3 | 3,337.7 |
| Depreciation, % | 0 | 3.54 | 3.34 | 4.22 | 3.73 | 2.97 | 2.97 | 2.97 | 2.97 | 2.97 |
| EBIT | 20,336.0 | 24,093.0 | 4,870.0 | 20,034.0 | 23,282.0 | 22,362.7 | 23,573.7 | 24,850.3 | 26,196.0 | 27,614.6 |
| EBIT, % | 28.12 | 32.04 | 6.3 | 29.35 | 26.95 | 24.55 | 24.55 | 24.55 | 24.55 | 24.55 |
| Total Cash | 1,216,774.0 | 1,375,103.0 | 1,001,855.0 | 983,679.0 | 807,017.0 | 91,075.7 | 96,007.8 | 101,206.9 | 106,687.6 | 112,465.1 |
| Total Cash, percent | .0 | .0 | .0 | .0 | .0 | .0 | .0 | .0 | .0 | .0 |
| Account Receivables | .0 | .0 | .0 | .0 | .0 | .0 | .0 | .0 | .0 | .0 |
| Account Receivables, % | 0 | 0 | 0 | 0 | 0 | 0 | 0 | 0 | 0 | 0 |
| Inventories | .0 | .0 | .0 | .0 | .0 | .0 | .0 | .0 | .0 | .0 |
| Inventories, % | 0 | 0 | 0 | 0 | 0 | 0 | 0 | 0 | 0 | 0 |
| Accounts Payable | .0 | .0 | .0 | .0 | .0 | .0 | .0 | .0 | .0 | .0 |
| Accounts Payable, % | 0 | 0 | 0 | 0 | 0 | 0 | 0 | 0 | 0 | 0 |
| Capital Expenditure | -2,290.0 | -3,288.0 | -3,001.0 | -1,838.0 | -2,823.0 | -3,166.5 | -3,338.0 | -3,518.7 | -3,709.3 | -3,910.1 |
| Capital Expenditure, % | -3.17 | -4.37 | -3.88 | -2.69 | -3.27 | -3.48 | -3.48 | -3.48 | -3.48 | -3.48 |
| Tax Rate, % | 24.32 | 24.32 | 24.32 | 24.32 | 24.32 | 24.32 | 24.32 | 24.32 | 24.32 | 24.32 |
| EBITAT | 13,456.0 | 15,460.0 | 3,924.0 | 15,020.0 | 17,618.8 | 16,170.9 | 17,046.6 | 17,969.7 | 18,942.8 | 19,968.7 |
| Depreciation | ||||||||||
| Changes in Account Receivables | ||||||||||
| Changes in Inventories | ||||||||||
| Changes in Accounts Payable | ||||||||||
| Capital Expenditure | ||||||||||
| UFCF | 11,166.0 | 14,836.0 | 3,507.0 | 16,064.0 | 18,017.8 | 15,707.3 | 16,557.9 | 17,454.6 | 18,399.8 | 19,396.2 |
| WACC, % | 2.9 | 2.84 | 3.34 | 3.17 | 3.19 | 3.09 | 3.09 | 3.09 | 3.09 | 3.09 |
| PV UFCF | ||||||||||
| SUM PV UFCF | 79,701.1 | |||||||||
| Long Term Growth Rate, % | 2.00 | |||||||||
| Free cash flow (T + 1) | 19,784 | |||||||||
| Terminal Value | 1,817,427 | |||||||||
| Present Terminal Value | 1,561,005 | |||||||||
| Enterprise Value | 1,640,706 | |||||||||
| Net Debt | 75,745 | |||||||||
| Equity Value | 1,564,961 | |||||||||
| Diluted Shares Outstanding, MM | 65 | |||||||||
| Equity Value Per Share | 24,189.45 |
What You Can Expect
- Pre-Filled Financial Model: Leverage The Kiyo Bank’s actual data for accurate DCF valuation.
- Comprehensive Forecast Control: Modify revenue growth, profit margins, WACC, and other essential drivers.
- Real-Time Calculations: Automatic updates let you see outcomes instantly as you adjust parameters.
- Investor-Ready Template: A polished Excel file crafted for professional-quality valuation.
- Customizable and Reusable: Designed for adaptability, allowing repeated use for in-depth forecasting.
Key Features
- 🔍 Real-Life Kiyo Bank Financials: Pre-filled historical and projected data for The Kiyo Bank, Ltd. (8370T).
- ✏️ Fully Customizable Inputs: Adjust all critical parameters (yellow cells) such as WACC, growth %, and tax rates.
- 📊 Professional DCF Valuation: Integrated formulas calculate The Kiyo Bank's intrinsic value using the Discounted Cash Flow method.
- ⚡ Instant Results: Visualize The Kiyo Bank's valuation immediately after making adjustments.
- Scenario Analysis: Evaluate and compare outcomes for different financial assumptions side-by-side.
How It Functions
- Download the Template: Gain immediate access to the Excel-based Kiyo Bank DCF Calculator.
- Input Your Assumptions: Modify the yellow-highlighted cells for growth rates, WACC, margins, and additional parameters.
- Instant Calculations: The model automatically recalculates Kiyo Bank’s intrinsic value.
- Test Scenarios: Experiment with various assumptions to assess potential shifts in valuation.
- Analyze and Decide: Leverage the findings to inform your investment or financial analysis.
Why Opt for The Kiyo Bank, Ltd. (8370T) Calculator?
- Save Time: Eliminate the hassle of building a DCF model from the ground up – it’s ready for immediate use.
- Enhance Accuracy: Dependable financial data and formulas minimize valuation errors.
- Completely Customizable: Adjust the model to align with your specific assumptions and forecasts.
- User-Friendly: Intuitive charts and outputs ensure the results are straightforward to analyze.
- Endorsed by Professionals: Crafted for experts who prioritize precision and ease of use.
Who Can Benefit from The Kiyo Bank, Ltd. (8370T)?
- Finance Students: Master financial analysis techniques and apply them to real-world data.
- Academics: Integrate professional financial models into your teaching or research projects.
- Investors: Validate your investment hypotheses and evaluate the performance of The Kiyo Bank, Ltd. (8370T).
- Financial Analysts: Enhance your efficiency with a customizable and ready-to-use financial modeling tool.
- Small Business Owners: Understand the analytical processes used to evaluate large public companies like The Kiyo Bank, Ltd. (8370T).
Contents of the Template
- Historical Data: Includes The Kiyo Bank's past financials and foundational forecasts.
- DCF and Levered DCF Models: Comprehensive templates for determining The Kiyo Bank’s intrinsic value.
- WACC Sheet: Pre-configured calculations for Weighted Average Cost of Capital.
- Editable Inputs: Customize key drivers such as growth rates, EBITDA percentages, and CAPEX assumptions.
- Quarterly and Annual Statements: A thorough analysis of The Kiyo Bank’s financial performance.
- Interactive Dashboard: Dynamically visualize valuation results and forecasts.
Disclaimer
All information, articles, and product details provided on this website are for general informational and educational purposes only. We do not claim any ownership over, nor do we intend to infringe upon, any trademarks, copyrights, logos, brand names, or other intellectual property mentioned or depicted on this site. Such intellectual property remains the property of its respective owners, and any references here are made solely for identification or informational purposes, without implying any affiliation, endorsement, or partnership.
We make no representations or warranties, express or implied, regarding the accuracy, completeness, or suitability of any content or products presented. Nothing on this website should be construed as legal, tax, investment, financial, medical, or other professional advice. In addition, no part of this site—including articles or product references—constitutes a solicitation, recommendation, endorsement, advertisement, or offer to buy or sell any securities, franchises, or other financial instruments, particularly in jurisdictions where such activity would be unlawful.
All content is of a general nature and may not address the specific circumstances of any individual or entity. It is not a substitute for professional advice or services. Any actions you take based on the information provided here are strictly at your own risk. You accept full responsibility for any decisions or outcomes arising from your use of this website and agree to release us from any liability in connection with your use of, or reliance upon, the content or products found herein.