
|
Mori Trust Sogo Reit, Inc. (8961.T) Valoración de DCF |
Completamente Editable: Adáptelo A Sus Necesidades En Excel O Sheets
Diseño Profesional: Plantillas Confiables Y Estándares De La Industria
Predeterminadas Para Un Uso Rápido Y Eficiente
Compatible con MAC / PC, completamente desbloqueado
No Se Necesita Experiencia; Fáciles De Seguir
MORI TRUST Sogo Reit, Inc. (8961.T) Bundle
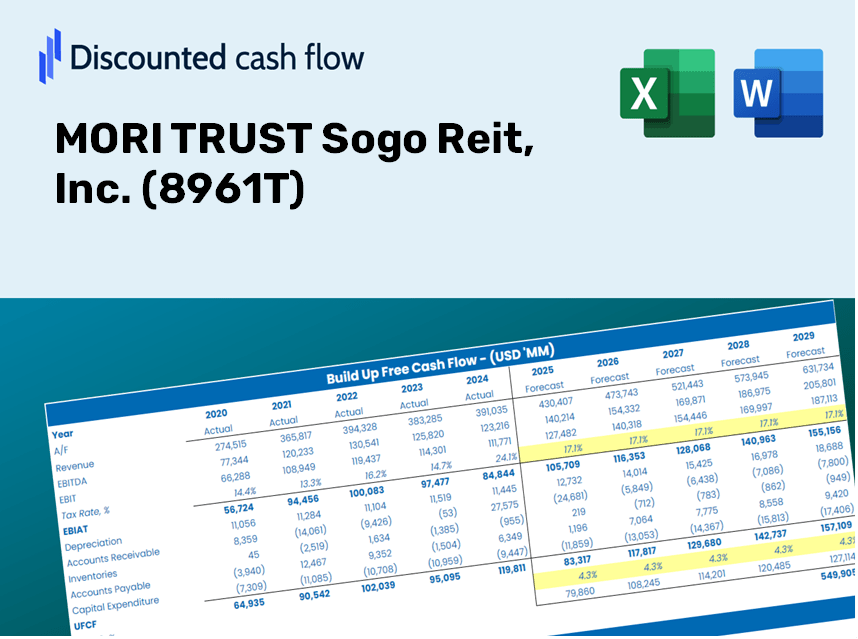
Diseñada para la precisión, nuestra calculadora DCF (8961T) le permite evaluar la valoración de Mori Trust Sogo Reit, Inc. utilizando datos financieros del mundo real y ofrece una flexibilidad completa para modificar todos los parámetros esenciales para obtener proyecciones mejoradas.
Discounted Cash Flow (DCF) - (USD MM)
| Year | AY1 2020 |
AY2 2021 |
AY3 2022 |
AY4 2023 |
AY5 2024 |
FY1 2025 |
FY2 2026 |
FY3 2027 |
FY4 2028 |
FY5 2029 |
|---|---|---|---|---|---|---|---|---|---|---|
| Revenue | 17,751.9 | 17,992.3 | 15,430.7 | 23,624.0 | 22,260.4 | 24,177.1 | 26,258.9 | 28,519.9 | 30,975.6 | 33,642.8 |
| Revenue Growth, % | 0 | 1.35 | -14.24 | 53.1 | -5.77 | 8.61 | 8.61 | 8.61 | 8.61 | 8.61 |
| EBITDA | 13,436.1 | 13,269.1 | 10,691.4 | 17,122.4 | 15,872.3 | 17,528.6 | 19,038.0 | 20,677.2 | 22,457.6 | 24,391.4 |
| EBITDA, % | 75.69 | 73.75 | 69.29 | 72.48 | 71.3 | 72.5 | 72.5 | 72.5 | 72.5 | 72.5 |
| Depreciation | 2,600.9 | 2,240.9 | 2,241.9 | 2,037.1 | 2,026.4 | 2,870.4 | 3,117.5 | 3,385.9 | 3,677.5 | 3,994.2 |
| Depreciation, % | 14.65 | 12.45 | 14.53 | 8.62 | 9.1 | 11.87 | 11.87 | 11.87 | 11.87 | 11.87 |
| EBIT | 10,835.3 | 11,028.2 | 8,449.5 | 15,085.2 | 13,845.8 | 14,658.3 | 15,920.4 | 17,291.3 | 18,780.1 | 20,397.2 |
| EBIT, % | 61.04 | 61.29 | 54.76 | 63.86 | 62.2 | 60.63 | 60.63 | 60.63 | 60.63 | 60.63 |
| Total Cash | 19,446.4 | 18,884.0 | 17,143.1 | 20,918.0 | 27,476.1 | 23,623.2 | 25,657.3 | 27,866.5 | 30,266.0 | 32,872.1 |
| Total Cash, percent | .0 | .0 | .0 | .0 | .0 | .0 | .0 | .0 | .0 | .0 |
| Account Receivables | 249.5 | 45.5 | 77.5 | 130.0 | 139.5 | 161.4 | 175.3 | 190.4 | 206.8 | 224.6 |
| Account Receivables, % | 1.41 | 0.25308 | 0.50246 | 0.55029 | 0.6266 | 0.66754 | 0.66754 | 0.66754 | 0.66754 | 0.66754 |
| Inventories | 2,907.2 | 3,034.0 | .0 | .0 | .0 | 1,607.3 | 1,745.7 | 1,896.0 | 2,059.2 | 2,236.6 |
| Inventories, % | 16.38 | 16.86 | 0 | 0 | 0 | 6.65 | 6.65 | 6.65 | 6.65 | 6.65 |
| Accounts Payable | 174.5 | 340.7 | 307.7 | 348.6 | 324.6 | 377.4 | 409.9 | 445.2 | 483.5 | 525.1 |
| Accounts Payable, % | 0.98298 | 1.89 | 1.99 | 1.48 | 1.46 | 1.56 | 1.56 | 1.56 | 1.56 | 1.56 |
| Capital Expenditure | -785.9 | -14,809.8 | -14,528.1 | -35,297.9 | -5,934.5 | -14,871.3 | -16,151.8 | -17,542.5 | -19,053.0 | -20,693.6 |
| Capital Expenditure, % | -4.43 | -82.31 | -94.15 | -149.42 | -26.66 | -61.51 | -61.51 | -61.51 | -61.51 | -61.51 |
| Tax Rate, % | 0.14357 | 0.14357 | 0.14357 | 0.14357 | 0.14357 | 0.14357 | 0.14357 | 0.14357 | 0.14357 | 0.14357 |
| EBITAT | 10,833.5 | 10,851.9 | 8,602.5 | 16,626.4 | 13,826.0 | 14,606.7 | 15,864.5 | 17,230.5 | 18,714.1 | 20,325.5 |
| Depreciation | ||||||||||
| Changes in Account Receivables | ||||||||||
| Changes in Inventories | ||||||||||
| Changes in Accounts Payable | ||||||||||
| Capital Expenditure | ||||||||||
| UFCF | 9,666.4 | -1,473.7 | -714.7 | -16,646.0 | 9,884.5 | 1,029.4 | 2,710.4 | 2,943.8 | 3,197.3 | 3,472.6 |
| WACC, % | 4.28 | 4.25 | 4.28 | 4.28 | 4.27 | 4.27 | 4.27 | 4.27 | 4.27 | 4.27 |
| PV UFCF | ||||||||||
| SUM PV UFCF | 11,598.7 | |||||||||
| Long Term Growth Rate, % | 2.00 | |||||||||
| Free cash flow (T + 1) | 3,542 | |||||||||
| Terminal Value | 155,944 | |||||||||
| Present Terminal Value | 126,515 | |||||||||
| Enterprise Value | 138,114 | |||||||||
| Net Debt | 197,024 | |||||||||
| Equity Value | -58,910 | |||||||||
| Diluted Shares Outstanding, MM | 4 | |||||||||
| Equity Value Per Share | -16,547.72 |
What You Will Receive
- Pre-Filled Financial Model: Leverage MORI TRUST Sogo Reit, Inc. (8961T)'s actual data for accurate DCF valuation.
- Complete Forecast Control: Modify revenue projections, profit margins, WACC, and other essential factors.
- Real-Time Calculations: Automatic updates provide immediate results as you make adjustments.
- Professional-Grade Template: A polished Excel file crafted for top-tier valuation.
- Flexible and Reusable: Designed for adaptability, facilitating multiple uses for thorough forecasting.
Key Features
- 🔍 Real-Life MORI TRUST Financials: Pre-filled historical and projected data for MORI TRUST Sogo Reit, Inc. (8961T).
- ✏️ Fully Customizable Inputs: Tailor all essential parameters (yellow cells) such as WACC, growth %, and tax rates.
- 📊 Professional DCF Valuation: Integrated formulas calculate the intrinsic value of MORI TRUST using the Discounted Cash Flow method.
- ⚡ Instant Results: Visualize MORI TRUST's valuation immediately after making adjustments.
- Scenario Analysis: Evaluate and compare outcomes for different financial assumptions side-by-side.
How It Functions
- Download: Obtain the pre-loaded Excel file containing financial data for MORI TRUST Sogo Reit, Inc. (8961T).
- Customize: Modify forecasts such as revenue growth, EBITDA percentage, and WACC as per your analysis.
- Automatic Updates: Enjoy real-time updates for intrinsic value and NPV calculations.
- Scenario Testing: Generate a variety of projections and instantly compare the results.
- Decision Making: Leverage the valuation outcomes to inform your investment approach.
Why Opt for the MORI TRUST Sogo Reit, Inc. Calculator?
- Designed for Experts: A sophisticated tool utilized by investors, asset managers, and financial advisors.
- Comprehensive Data: MORI TRUST’s historical and projected financial figures preloaded for precision.
- Flexible Scenario Analysis: Effortlessly test various forecasts and assumptions.
- Concise Results: Instantly calculates intrinsic value, NPV, and essential metrics.
- User-Friendly: Step-by-step guidance to simplify your calculations.
Who Can Benefit from MORI TRUST Sogo Reit, Inc. (8961T)?
- Investors: Leverage a professional-grade valuation tool to make informed investment choices.
- Financial Analysts: Streamline your workflow with a customizable DCF model designed for efficiency.
- Consultants: Easily modify the template for impactful client presentations or comprehensive reports.
- Real Estate Enthusiasts: Enhance your grasp of valuation methods through practical, real-world case studies.
- Educators and Students: Utilize this resource as a hands-on learning aid in finance and real estate courses.
Contents of the Template
- Pre-Filled Data: Contains MORI TRUST Sogo Reit, Inc.'s historical financial performance and projections.
- Discounted Cash Flow Model: A customizable DCF valuation model featuring automatic calculations.
- Weighted Average Cost of Capital (WACC): A specific sheet for determining WACC using personalized inputs.
- Key Financial Ratios: Assess MORI TRUST Sogo Reit, Inc.'s profitability, efficiency, and leverage metrics.
- Customizable Inputs: Easily adjust revenue growth, profit margins, and tax rates.
- User-Friendly Dashboard: Visual representations and tables that summarize essential valuation insights.
Disclaimer
All information, articles, and product details provided on this website are for general informational and educational purposes only. We do not claim any ownership over, nor do we intend to infringe upon, any trademarks, copyrights, logos, brand names, or other intellectual property mentioned or depicted on this site. Such intellectual property remains the property of its respective owners, and any references here are made solely for identification or informational purposes, without implying any affiliation, endorsement, or partnership.
We make no representations or warranties, express or implied, regarding the accuracy, completeness, or suitability of any content or products presented. Nothing on this website should be construed as legal, tax, investment, financial, medical, or other professional advice. In addition, no part of this site—including articles or product references—constitutes a solicitation, recommendation, endorsement, advertisement, or offer to buy or sell any securities, franchises, or other financial instruments, particularly in jurisdictions where such activity would be unlawful.
All content is of a general nature and may not address the specific circumstances of any individual or entity. It is not a substitute for professional advice or services. Any actions you take based on the information provided here are strictly at your own risk. You accept full responsibility for any decisions or outcomes arising from your use of this website and agree to release us from any liability in connection with your use of, or reliance upon, the content or products found herein.