
|
Electric Power Development Co., Ltd. (9513.T) Valoración de DCF |
Completamente Editable: Adáptelo A Sus Necesidades En Excel O Sheets
Diseño Profesional: Plantillas Confiables Y Estándares De La Industria
Predeterminadas Para Un Uso Rápido Y Eficiente
Compatible con MAC / PC, completamente desbloqueado
No Se Necesita Experiencia; Fáciles De Seguir
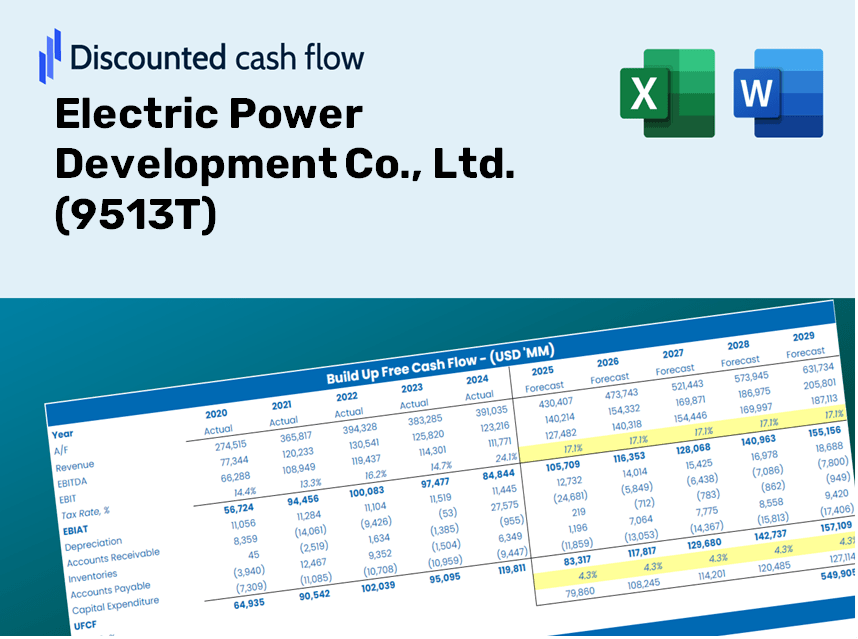
Electric Power Development Co., Ltd. (9513.T) Bundle
¡Simplifique Electric Power Development Co., Ltd. (9513T) Valoración con esta calculadora DCF personalizable! Con Real Electric Power Development Co., Ltd. (9513T) financieras y entradas de pronóstico ajustable, puede probar escenarios y descubrir Electric Power Development Co., Ltd. (9513T) valor razonable en minutos.
Discounted Cash Flow (DCF) - (USD MM)
| Year | AY1 2021 |
AY2 2022 |
AY3 2023 |
AY4 2024 |
AY5 2025 |
FY1 2026 |
FY2 2027 |
FY3 2028 |
FY4 2029 |
FY5 2030 |
|---|---|---|---|---|---|---|---|---|---|---|
| Revenue | 909,143.0 | 1,084,620.0 | 1,841,921.0 | 1,257,998.0 | 1,316,674.0 | 1,521,040.0 | 1,757,126.5 | 2,029,856.8 | 2,344,918.7 | 2,708,882.5 |
| Revenue Growth, % | 0 | 19.3 | 69.82 | -31.7 | 4.66 | 15.52 | 15.52 | 15.52 | 15.52 | 15.52 |
| EBITDA | 174,220.0 | 192,285.0 | 305,802.0 | 216,018.0 | 254,716.0 | 273,819.9 | 316,320.6 | 365,417.9 | 422,135.8 | 487,657.1 |
| EBITDA, % | 19.16 | 17.73 | 16.6 | 17.17 | 19.35 | 18 | 18 | 18 | 18 | 18 |
| Depreciation | 96,445.0 | 96,997.0 | 107,642.0 | 110,313.0 | 116,405.0 | 130,824.9 | 151,130.7 | 174,588.3 | 201,686.8 | 232,991.3 |
| Depreciation, % | 10.61 | 8.94 | 5.84 | 8.77 | 8.84 | 8.6 | 8.6 | 8.6 | 8.6 | 8.6 |
| EBIT | 77,775.0 | 95,288.0 | 198,160.0 | 105,705.0 | 138,311.0 | 142,995.1 | 165,189.9 | 190,829.6 | 220,449.0 | 254,665.8 |
| EBIT, % | 8.55 | 8.79 | 10.76 | 8.4 | 10.5 | 9.4 | 9.4 | 9.4 | 9.4 | 9.4 |
| Total Cash | 189,842.0 | 223,072.0 | 342,018.0 | 431,960.0 | 416,459.0 | 383,252.0 | 442,738.0 | 511,457.0 | 590,842.2 | 682,549.1 |
| Total Cash, percent | .0 | .0 | .0 | .0 | .0 | .0 | .0 | .0 | .0 | .0 |
| Account Receivables | 65,788.0 | 80,436.0 | 129,898.0 | 98,116.0 | 112,207.0 | 115,678.2 | 133,633.0 | 154,374.7 | 178,335.8 | 206,016.0 |
| Account Receivables, % | 7.24 | 7.42 | 7.05 | 7.8 | 8.52 | 7.61 | 7.61 | 7.61 | 7.61 | 7.61 |
| Inventories | 46,085.0 | 62,173.0 | 110,315.0 | 80,059.0 | 72,191.0 | 87,116.8 | 100,638.6 | 116,259.1 | 134,304.1 | 155,149.9 |
| Inventories, % | 5.07 | 5.73 | 5.99 | 6.36 | 5.48 | 5.73 | 5.73 | 5.73 | 5.73 | 5.73 |
| Accounts Payable | 23,625.0 | 44,651.0 | 53,774.0 | 52,379.0 | 61,997.0 | 56,300.0 | 65,038.6 | 75,133.4 | 86,795.2 | 100,267.0 |
| Accounts Payable, % | 2.6 | 4.12 | 2.92 | 4.16 | 4.71 | 3.7 | 3.7 | 3.7 | 3.7 | 3.7 |
| Capital Expenditure | -159,296.0 | -135,282.0 | -144,862.0 | -115,840.0 | -123,920.0 | -171,813.4 | -198,481.2 | -229,288.2 | -264,876.9 | -305,989.5 |
| Capital Expenditure, % | -17.52 | -12.47 | -7.86 | -9.21 | -9.41 | -11.3 | -11.3 | -11.3 | -11.3 | -11.3 |
| Tax Rate, % | 33.99 | 33.99 | 33.99 | 33.99 | 33.99 | 33.99 | 33.99 | 33.99 | 33.99 | 33.99 |
| EBITAT | 26,822.1 | 91,155.8 | 131,906.7 | 69,355.9 | 91,292.8 | 93,900.3 | 108,475.0 | 125,311.8 | 144,761.9 | 167,230.9 |
| Depreciation | ||||||||||
| Changes in Account Receivables | ||||||||||
| Changes in Inventories | ||||||||||
| Changes in Accounts Payable | ||||||||||
| Capital Expenditure | ||||||||||
| UFCF | -124,276.9 | 43,160.8 | 6,205.7 | 124,471.9 | 87,172.8 | 28,817.8 | 38,386.4 | 44,344.5 | 51,227.4 | 59,178.6 |
| WACC, % | 2.04 | 3.7 | 2.91 | 2.88 | 2.89 | 2.88 | 2.88 | 2.88 | 2.88 | 2.88 |
| PV UFCF | ||||||||||
| SUM PV UFCF | 202,047.8 | |||||||||
| Long Term Growth Rate, % | 0.50 | |||||||||
| Free cash flow (T + 1) | 59,474 | |||||||||
| Terminal Value | 2,494,310 | |||||||||
| Present Terminal Value | 2,163,728 | |||||||||
| Enterprise Value | 2,365,776 | |||||||||
| Net Debt | 1,352,294 | |||||||||
| Equity Value | 1,013,482 | |||||||||
| Diluted Shares Outstanding, MM | 183 | |||||||||
| Equity Value Per Share | 5,541.94 |
What You Will Receive
- Authentic Electric Power Data: Pre-loaded financial figures – encompassing revenue and EBIT – derived from actual and projected statistics.
- Comprehensive Customization: Modify all key parameters (highlighted cells) such as WACC, growth percentages, and tax rates.
- Instantaneous Valuation Adjustments: Automatic recalculations to evaluate the effects of changes on the fair value of Electric Power Development Co., Ltd. (9513T).
- Flexible Excel Template: Designed for quick modifications, scenario analysis, and in-depth projections.
- Efficient and Precise: Bypass the need to construct models from the ground up while ensuring accuracy and adaptability.
Essential Features
- Pre-Configured Data: Access Electric Power Development Co., Ltd.'s historical financial records and pre-populated forecasts.
- Customizable Inputs: Adjust WACC, tax rates, revenue growth, and EBITDA margins to fit your analysis.
- Real-Time Results: Watch the intrinsic value of Electric Power Development Co., Ltd. (9513T) update instantly.
- Intuitive Visual Outputs: Utilize dashboard charts to view valuation results and critical metrics clearly.
- Designed for Precision: A reliable tool tailored for analysts, investors, and finance professionals.
How It Works
- Download: Get the ready-to-use Excel file featuring Electric Power Development Co., Ltd. (9513T)'s financial data.
- Customize: Fine-tune forecasts, such as revenue projections, EBITDA percentages, and WACC.
- Update Automatically: Watch as intrinsic value and NPV calculations refresh in real-time.
- Test Scenarios: Develop multiple projections and instantly compare their outcomes.
- Make Decisions: Leverage the valuation results to inform your investment strategy.
Why Opt for This Calculator?
- All-in-One Solution: Integrates DCF, WACC, and financial ratio analyses tailored for Electric Power Development Co., Ltd. (9513T).
- Adjustable Parameters: Modify the yellow-highlighted fields to explore different financial scenarios.
- In-Depth Analysis: Automatically computes intrinsic value and Net Present Value for Electric Power Development Co., Ltd. (9513T).
- Data-Ready: Comes with historical and projected data for precise calculations.
- High-Caliber Tool: Perfect for financial analysts, investors, and business consultants focused on Electric Power Development Co., Ltd. (9513T).
Who Can Benefit from This Product?
- Investors: Evaluate Electric Power Development Co., Ltd.'s (9513T) valuation before making stock transactions.
- CFOs and Financial Analysts: Enhance valuation methodologies and assess financial projections.
- Startup Founders: Gain insights into the valuation practices of significant public entities like Electric Power Development Co., Ltd. (9513T).
- Consultants: Create comprehensive valuation reports for your clients.
- Students and Educators: Utilize real-world data from Electric Power Development Co., Ltd. (9513T) to learn and teach valuation strategies.
Contents of the Template
- Pre-Filled Data: Contains historical financials and projections for Electric Power Development Co., Ltd. (9513T).
- Discounted Cash Flow Model: An editable DCF valuation model with automated calculations.
- Weighted Average Cost of Capital (WACC): A separate sheet for calculating WACC using customized inputs.
- Key Financial Ratios: Assess profitability, efficiency, and leverage for Electric Power Development Co., Ltd. (9513T).
- Customizable Inputs: Easily modify revenue growth, profit margins, and tax rates.
- Clear Dashboard: Visual representations like charts and tables summarizing essential valuation outcomes.
Disclaimer
All information, articles, and product details provided on this website are for general informational and educational purposes only. We do not claim any ownership over, nor do we intend to infringe upon, any trademarks, copyrights, logos, brand names, or other intellectual property mentioned or depicted on this site. Such intellectual property remains the property of its respective owners, and any references here are made solely for identification or informational purposes, without implying any affiliation, endorsement, or partnership.
We make no representations or warranties, express or implied, regarding the accuracy, completeness, or suitability of any content or products presented. Nothing on this website should be construed as legal, tax, investment, financial, medical, or other professional advice. In addition, no part of this site—including articles or product references—constitutes a solicitation, recommendation, endorsement, advertisement, or offer to buy or sell any securities, franchises, or other financial instruments, particularly in jurisdictions where such activity would be unlawful.
All content is of a general nature and may not address the specific circumstances of any individual or entity. It is not a substitute for professional advice or services. Any actions you take based on the information provided here are strictly at your own risk. You accept full responsibility for any decisions or outcomes arising from your use of this website and agree to release us from any liability in connection with your use of, or reliance upon, the content or products found herein.