
|
ABB India Limited (ABB.NS) DCF Valoración |
Completamente Editable: Adáptelo A Sus Necesidades En Excel O Sheets
Diseño Profesional: Plantillas Confiables Y Estándares De La Industria
Predeterminadas Para Un Uso Rápido Y Eficiente
Compatible con MAC / PC, completamente desbloqueado
No Se Necesita Experiencia; Fáciles De Seguir
ABB India Limited (ABB.NS) Bundle
¡Simplifique la valoración de ABB India Limited (ABBNS) con esta calculadora DCF personalizable! Con el Real ABB India Limited (ABBNS) finanzas y aportes de pronóstico ajustables, puede probar escenarios y descubrir el valor razonable de ABB India Limited (ABBNS) en minutos.
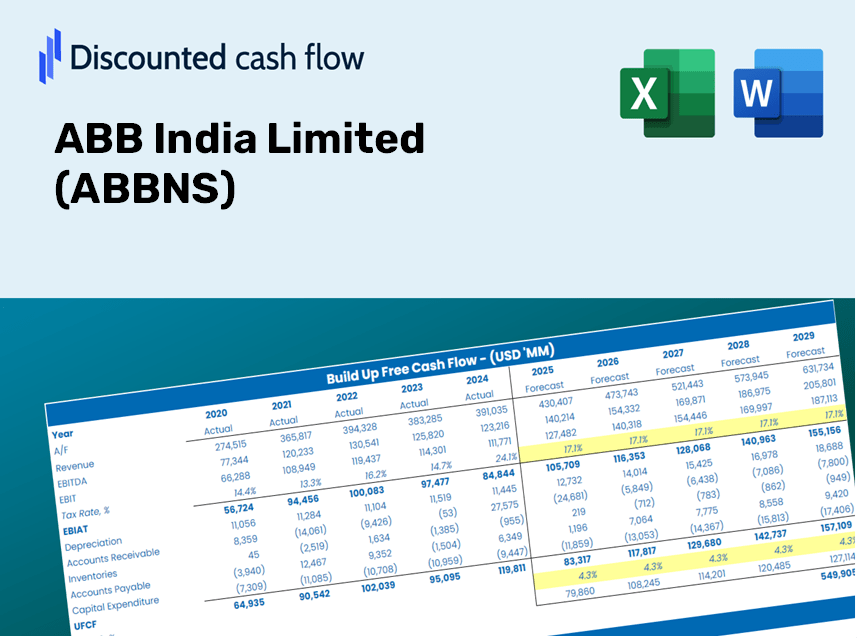
Discounted Cash Flow (DCF) - (USD MM)
| Year | AY1 2020 |
AY2 2021 |
AY3 2022 |
AY4 2023 |
AY5 2024 |
FY1 2025 |
FY2 2026 |
FY3 2027 |
FY4 2028 |
FY5 2029 |
|---|---|---|---|---|---|---|---|---|---|---|
| Revenue | 57,571.7 | 68,640.2 | 84,984.1 | 103,666.8 | 120,876.7 | 145,542.0 | 175,240.4 | 210,998.9 | 254,054.0 | 305,894.7 |
| Revenue Growth, % | 0 | 19.23 | 23.81 | 21.98 | 16.6 | 20.41 | 20.41 | 20.41 | 20.41 | 20.41 |
| EBITDA | 4,349.1 | 8,360.7 | 14,787.7 | 17,910.8 | 26,575.8 | 22,238.4 | 26,776.2 | 32,240.0 | 38,818.6 | 46,739.7 |
| EBITDA, % | 7.55 | 12.18 | 17.4 | 17.28 | 21.99 | 15.28 | 15.28 | 15.28 | 15.28 | 15.28 |
| Depreciation | 1,203.6 | 1,027.0 | 1,047.0 | 1,199.2 | 1,289.2 | 2,049.9 | 2,468.1 | 2,971.8 | 3,578.2 | 4,308.3 |
| Depreciation, % | 2.09 | 1.5 | 1.23 | 1.16 | 1.07 | 1.41 | 1.41 | 1.41 | 1.41 | 1.41 |
| EBIT | 3,145.5 | 7,333.7 | 13,740.7 | 16,711.6 | 25,286.6 | 20,188.5 | 24,308.0 | 29,268.2 | 35,240.5 | 42,431.4 |
| EBIT, % | 5.46 | 10.68 | 16.17 | 16.12 | 20.92 | 13.87 | 13.87 | 13.87 | 13.87 | 13.87 |
| Total Cash | 22,040.3 | 26,851.4 | 36,400.1 | 48,145.9 | 56,035.7 | 62,011.0 | 74,664.6 | 89,900.1 | 108,244.6 | 130,332.3 |
| Total Cash, percent | .0 | .0 | .0 | .0 | .0 | .0 | .0 | .0 | .0 | .0 |
| Account Receivables | 27,393.4 | 26,836.8 | 25,464.6 | 26,888.7 | 29,899.5 | 48,703.1 | 58,641.2 | 70,607.1 | 85,014.7 | 102,362.3 |
| Account Receivables, % | 47.58 | 39.1 | 29.96 | 25.94 | 24.74 | 33.46 | 33.46 | 33.46 | 33.46 | 33.46 |
| Inventories | 8,408.3 | 10,090.9 | 14,206.6 | 15,607.6 | 17,779.9 | 22,060.5 | 26,562.1 | 31,982.2 | 38,508.2 | 46,366.0 |
| Inventories, % | 14.6 | 14.7 | 16.72 | 15.06 | 14.71 | 15.16 | 15.16 | 15.16 | 15.16 | 15.16 |
| Accounts Payable | 17,207.4 | 22,336.7 | 26,367.6 | 31,090.8 | 31,980.2 | 43,634.9 | 52,538.8 | 63,259.5 | 76,167.9 | 91,710.2 |
| Accounts Payable, % | 29.89 | 32.54 | 31.03 | 29.99 | 26.46 | 29.98 | 29.98 | 29.98 | 29.98 | 29.98 |
| Capital Expenditure | -1,213.8 | -1,722.8 | -1,679.6 | -1,830.8 | -2,139.5 | -2,948.9 | -3,550.6 | -4,275.1 | -5,147.5 | -6,197.8 |
| Capital Expenditure, % | -2.11 | -2.51 | -1.98 | -1.77 | -1.77 | -2.03 | -2.03 | -2.03 | -2.03 | -2.03 |
| Tax Rate, % | 25.53 | 25.53 | 25.53 | 25.53 | 25.53 | 25.53 | 25.53 | 25.53 | 25.53 | 25.53 |
| EBITAT | 2,265.5 | 5,262.4 | 10,246.4 | 12,512.4 | 18,831.1 | 14,846.4 | 17,875.8 | 21,523.4 | 25,915.4 | 31,203.5 |
| Depreciation | ||||||||||
| Changes in Account Receivables | ||||||||||
| Changes in Inventories | ||||||||||
| Changes in Accounts Payable | ||||||||||
| Capital Expenditure | ||||||||||
| UFCF | -16,339.0 | 8,569.9 | 10,901.2 | 13,778.9 | 13,687.1 | 2,517.8 | 11,257.6 | 13,554.8 | 16,320.7 | 19,651.0 |
| WACC, % | 6.56 | 6.56 | 6.56 | 6.56 | 6.56 | 6.56 | 6.56 | 6.56 | 6.56 | 6.56 |
| PV UFCF | ||||||||||
| SUM PV UFCF | 50,444.4 | |||||||||
| Long Term Growth Rate, % | 4.00 | |||||||||
| Free cash flow (T + 1) | 20,437 | |||||||||
| Terminal Value | 799,157 | |||||||||
| Present Terminal Value | 581,722 | |||||||||
| Enterprise Value | 632,166 | |||||||||
| Net Debt | -8,838 | |||||||||
| Equity Value | 641,004 | |||||||||
| Diluted Shares Outstanding, MM | 212 | |||||||||
| Equity Value Per Share | 3,024.80 |
What You Will Receive
- Authentic ABBNS Financials: Access to historical and projected data for precise valuation.
- Customizable Inputs: Adjust WACC, tax rates, revenue growth, and capital expenditure assumptions.
- Automated Calculations: Dynamic computation of intrinsic value and NPV.
- Scenario Testing: Evaluate various scenarios to assess ABB India’s future performance.
- User-Friendly Design: Tailored for professionals but easy to navigate for newcomers.
Key Features
- Comprehensive ABB Financials: Gain access to precise historical data and forward-looking estimates for ABB India Limited (ABBNS).
- Adjustable Forecast Parameters: Modify yellow-highlighted cells, including WACC, growth rates, and profit margins.
- Real-Time Calculations: Automatically refresh DCF, Net Present Value (NPV), and cash flow analysis based on your inputs.
- User-Friendly Dashboard: Intuitive charts and summaries to help visualize your valuation insights.
- Suitable for All Skill Levels: Designed for investors, CFOs, and consultants with a straightforward and accessible format.
How It Works
- Step 1: Download the Excel file for ABB India Limited (ABBNS).
- Step 2: Review the pre-filled financial data and forecasts provided for ABB India Limited (ABBNS).
- Step 3: Adjust key inputs such as revenue growth, WACC, and tax rates (highlighted cells) for ABB India Limited (ABBNS).
- Step 4: Observe how the DCF model updates in real-time as you modify your assumptions for ABB India Limited (ABBNS).
- Step 5: Analyze the results and leverage them for your investment decisions concerning ABB India Limited (ABBNS).
Why Choose the ABB India Limited (ABBNS) Calculator?
- Precision: Leveraging authentic ABB financial data for unparalleled accuracy.
- Versatility: Crafted for users to explore and adjust inputs with ease.
- Efficiency: Eliminate the complexity of creating a DCF model from the ground up.
- Expert-Level: Built with the insight and usability expected from top financial professionals.
- Intuitive Design: Accessible for all users, regardless of prior financial modeling expertise.
Who Can Benefit from This Product?
- Finance Students: Explore valuation methodologies and apply them to real-time data.
- Academics: Integrate industry-standard models into your academic programs or research initiatives.
- Investors: Evaluate your investment hypotheses and analyze valuation metrics for ABB India Limited (ABBNS).
- Analysts: Enhance your efficiency with a customizable, ready-to-use DCF model.
- Small Business Owners: Understand how major public firms like ABB India Limited (ABBNS) are assessed in the market.
Contents of the Template
- Historical Data: Contains ABB India Limited’s past financial metrics and initial forecasts.
- DCF and Levered DCF Models: Comprehensive templates for determining the intrinsic value of ABB India Limited (ABBNS).
- WACC Sheet: Ready-to-use calculations for Weighted Average Cost of Capital.
- Editable Inputs: Adjust essential drivers such as growth rates, EBITDA percentages, and CAPEX assumptions.
- Quarterly and Annual Statements: An in-depth analysis of ABB India Limited's financial performance.
- Interactive Dashboard: Explore valuation results and projections through dynamic visualizations.
Disclaimer
All information, articles, and product details provided on this website are for general informational and educational purposes only. We do not claim any ownership over, nor do we intend to infringe upon, any trademarks, copyrights, logos, brand names, or other intellectual property mentioned or depicted on this site. Such intellectual property remains the property of its respective owners, and any references here are made solely for identification or informational purposes, without implying any affiliation, endorsement, or partnership.
We make no representations or warranties, express or implied, regarding the accuracy, completeness, or suitability of any content or products presented. Nothing on this website should be construed as legal, tax, investment, financial, medical, or other professional advice. In addition, no part of this site—including articles or product references—constitutes a solicitation, recommendation, endorsement, advertisement, or offer to buy or sell any securities, franchises, or other financial instruments, particularly in jurisdictions where such activity would be unlawful.
All content is of a general nature and may not address the specific circumstances of any individual or entity. It is not a substitute for professional advice or services. Any actions you take based on the information provided here are strictly at your own risk. You accept full responsibility for any decisions or outcomes arising from your use of this website and agree to release us from any liability in connection with your use of, or reliance upon, the content or products found herein.