
|
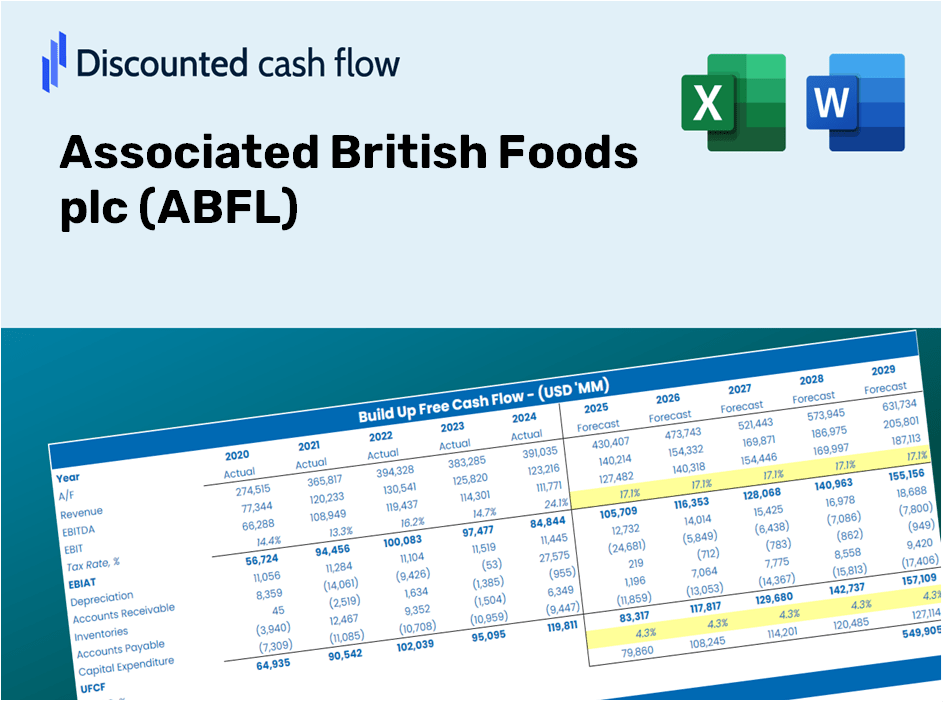
Valoración de DCF de British Foods PLC (ABF.L) |
Completamente Editable: Adáptelo A Sus Necesidades En Excel O Sheets
Diseño Profesional: Plantillas Confiables Y Estándares De La Industria
Predeterminadas Para Un Uso Rápido Y Eficiente
Compatible con MAC / PC, completamente desbloqueado
No Se Necesita Experiencia; Fáciles De Seguir
Associated British Foods plc (ABF.L) Bundle
¡Obtenga información sobre su análisis de valoración British Foods PLC (ABFL) asociado utilizando nuestra sofisticada calculadora DCF! Prelabastado con datos reales (ABFL), esta plantilla de Excel le permite ajustar preventos y supuestos para un cálculo preciso del valor intrínseco de British Foods PLC asociado.
Discounted Cash Flow (DCF) - (USD MM)
| Year | AY1 2020 |
AY2 2021 |
AY3 2022 |
AY4 2023 |
AY5 2024 |
FY1 2025 |
FY2 2026 |
FY3 2027 |
FY4 2028 |
FY5 2029 |
|---|---|---|---|---|---|---|---|---|---|---|
| Revenue | 13,937.0 | 13,884.0 | 16,997.0 | 19,750.0 | 20,073.0 | 22,074.0 | 24,274.4 | 26,694.1 | 29,355.1 | 32,281.4 |
| Revenue Growth, % | 0 | -0.38028 | 22.42 | 16.2 | 1.64 | 9.97 | 9.97 | 9.97 | 9.97 | 9.97 |
| EBITDA | 1,806.0 | 1,802.0 | 2,130.0 | 2,476.0 | 3,132.0 | 2,940.6 | 3,233.8 | 3,556.1 | 3,910.6 | 4,300.4 |
| EBITDA, % | 12.96 | 12.98 | 12.53 | 12.54 | 15.6 | 13.32 | 13.32 | 13.32 | 13.32 | 13.32 |
| Depreciation | 916.0 | 897.0 | 870.0 | 886.0 | 949.0 | 1,208.1 | 1,328.6 | 1,461.0 | 1,606.6 | 1,766.8 |
| Depreciation, % | 6.57 | 6.46 | 5.12 | 4.49 | 4.73 | 5.47 | 5.47 | 5.47 | 5.47 | 5.47 |
| EBIT | 890.0 | 905.0 | 1,260.0 | 1,590.0 | 2,183.0 | 1,732.5 | 1,905.2 | 2,095.1 | 2,304.0 | 2,533.6 |
| EBIT, % | 6.39 | 6.52 | 7.41 | 8.05 | 10.88 | 7.85 | 7.85 | 7.85 | 7.85 | 7.85 |
| Total Cash | 2,028.0 | 2,307.0 | 2,125.0 | 1,457.0 | 1,657.0 | 2,618.0 | 2,879.0 | 3,166.0 | 3,481.6 | 3,828.7 |
| Total Cash, percent | .0 | .0 | .0 | .0 | .0 | .0 | .0 | .0 | .0 | .0 |
| Account Receivables | 1,358.0 | 1,425.0 | 1,825.0 | 1,880.0 | 1,799.0 | 2,173.2 | 2,389.9 | 2,628.1 | 2,890.1 | 3,178.2 |
| Account Receivables, % | 9.74 | 10.26 | 10.74 | 9.52 | 8.96 | 9.85 | 9.85 | 9.85 | 9.85 | 9.85 |
| Inventories | 2,222.0 | 2,236.0 | 3,364.0 | 3,306.0 | 3,036.0 | 3,695.3 | 4,063.7 | 4,468.8 | 4,914.3 | 5,404.1 |
| Inventories, % | 15.94 | 16.1 | 19.79 | 16.74 | 15.12 | 16.74 | 16.74 | 16.74 | 16.74 | 16.74 |
| Accounts Payable | 909.0 | 938.0 | 1,362.0 | 1,177.0 | 1,159.0 | 1,458.0 | 1,603.3 | 1,763.1 | 1,938.9 | 2,132.2 |
| Accounts Payable, % | 6.52 | 6.76 | 8.01 | 5.96 | 5.77 | 6.6 | 6.6 | 6.6 | 6.6 | 6.6 |
| Capital Expenditure | -622.0 | -627.0 | -769.0 | -1,073.0 | -1,124.0 | -1,083.2 | -1,191.2 | -1,309.9 | -1,440.5 | -1,584.1 |
| Capital Expenditure, % | -4.46 | -4.52 | -4.52 | -5.43 | -5.6 | -4.91 | -4.91 | -4.91 | -4.91 | -4.91 |
| Tax Rate, % | 24.1 | 24.1 | 24.1 | 24.1 | 24.1 | 24.1 | 24.1 | 24.1 | 24.1 | 24.1 |
| EBITAT | 590.3 | 596.7 | 819.7 | 1,238.8 | 1,656.9 | 1,216.6 | 1,337.9 | 1,471.3 | 1,618.0 | 1,779.2 |
| Depreciation | ||||||||||
| Changes in Account Receivables | ||||||||||
| Changes in Inventories | ||||||||||
| Changes in Accounts Payable | ||||||||||
| Capital Expenditure | ||||||||||
| UFCF | -1,786.7 | 814.7 | -183.3 | 869.8 | 1,814.9 | 607.0 | 1,035.6 | 1,138.9 | 1,252.4 | 1,377.3 |
| WACC, % | 7.77 | 7.76 | 7.75 | 7.93 | 7.9 | 7.82 | 7.82 | 7.82 | 7.82 | 7.82 |
| PV UFCF | ||||||||||
| SUM PV UFCF | 4,234.1 | |||||||||
| Long Term Growth Rate, % | 2.00 | |||||||||
| Free cash flow (T + 1) | 1,405 | |||||||||
| Terminal Value | 24,131 | |||||||||
| Present Terminal Value | 16,559 | |||||||||
| Enterprise Value | 20,793 | |||||||||
| Net Debt | 2,355 | |||||||||
| Equity Value | 18,438 | |||||||||
| Diluted Shares Outstanding, MM | 751 | |||||||||
| Equity Value Per Share | 2,455.16 |
What Awaits You
- Accurate ABFL Financial Data: Pre-populated with Associated British Foods' historical and forecasted figures for in-depth analysis.
- Completely Customizable Template: Easily adjust critical inputs such as revenue growth, WACC, and EBITDA margin.
- Instant Calculations: Observe real-time updates to ABFL's intrinsic value as you make modifications.
- Expert Valuation Tool: Crafted for investors, analysts, and consultants in need of reliable DCF results.
- User-Friendly Interface: Intuitive layout and straightforward instructions suitable for all skill levels.
Key Features
- Comprehensive DCF Calculator: Features in-depth unlevered and levered DCF valuation frameworks.
- WACC Calculator: Ready-to-use Weighted Average Cost of Capital tool with adjustable parameters.
- Customizable Forecast Assumptions: Update growth projections, capital spending, and discount rates.
- Integrated Financial Ratios: Evaluate profitability, leverage, and efficiency metrics for Associated British Foods plc (ABFL).
- Visual Dashboard and Charts: Graphic representations that highlight essential valuation indicators for straightforward analysis.
How It Works
- Step 1: Download the Excel file.
- Step 2: Review the pre-filled data for Associated British Foods plc (ABFL) including historical and projected figures.
- Step 3: Modify the key assumptions (highlighted in yellow) according to your analysis.
- Step 4: Observe the automatic recalculations for the intrinsic value of Associated British Foods plc (ABFL).
- Step 5: Utilize the results for your investment strategies or reporting needs.
Why Opt for This Calculator?
- Designed for Experts: A sophisticated tool tailored for analysts, CFOs, and consultants.
- Accurate Financial Data: Historical and projected financials for Associated British Foods plc (ABFL) integrated for precision.
- Flexible Scenario Analysis: Effortlessly test various forecasts and assumptions.
- Comprehensive Outputs: Automatically computes intrinsic value, NPV, and essential metrics.
- User-Friendly: Step-by-step guidance makes the process straightforward.
Who Should Utilize This Product?
- Investors: Assess the true value of Associated British Foods plc (ABFL) before making investment choices.
- CFOs: Utilize a high-quality DCF model for accurate financial analysis and reporting.
- Consultants: Effortlessly customize the template for client valuation reports.
- Entrepreneurs: Discover financial modeling techniques used by leading companies.
- Educators: Employ it as a resource to illustrate valuation methodologies in the classroom.
Contents of the Template
- Pre-Filled Data: Contains historical financials and forecasts for Associated British Foods plc (ABFL).
- Discounted Cash Flow Model: An editable DCF valuation model with automatic calculation features.
- Weighted Average Cost of Capital (WACC): A specific sheet for calculating WACC using user-defined inputs.
- Key Financial Ratios: Evaluate ABFL’s profitability, efficiency, and leverage metrics.
- Customizable Inputs: Easily modify revenue growth, profit margins, and tax rates.
- Clear Dashboard: Visualizations and tables that summarize essential valuation outcomes.
Disclaimer
All information, articles, and product details provided on this website are for general informational and educational purposes only. We do not claim any ownership over, nor do we intend to infringe upon, any trademarks, copyrights, logos, brand names, or other intellectual property mentioned or depicted on this site. Such intellectual property remains the property of its respective owners, and any references here are made solely for identification or informational purposes, without implying any affiliation, endorsement, or partnership.
We make no representations or warranties, express or implied, regarding the accuracy, completeness, or suitability of any content or products presented. Nothing on this website should be construed as legal, tax, investment, financial, medical, or other professional advice. In addition, no part of this site—including articles or product references—constitutes a solicitation, recommendation, endorsement, advertisement, or offer to buy or sell any securities, franchises, or other financial instruments, particularly in jurisdictions where such activity would be unlawful.
All content is of a general nature and may not address the specific circumstances of any individual or entity. It is not a substitute for professional advice or services. Any actions you take based on the information provided here are strictly at your own risk. You accept full responsibility for any decisions or outcomes arising from your use of this website and agree to release us from any liability in connection with your use of, or reliance upon, the content or products found herein.