
|
Valoración DCF de Aurora Cannabis Inc. (ACB) |
Completamente Editable: Adáptelo A Sus Necesidades En Excel O Sheets
Diseño Profesional: Plantillas Confiables Y Estándares De La Industria
Predeterminadas Para Un Uso Rápido Y Eficiente
Compatible con MAC / PC, completamente desbloqueado
No Se Necesita Experiencia; Fáciles De Seguir
Aurora Cannabis Inc. (ACB) Bundle
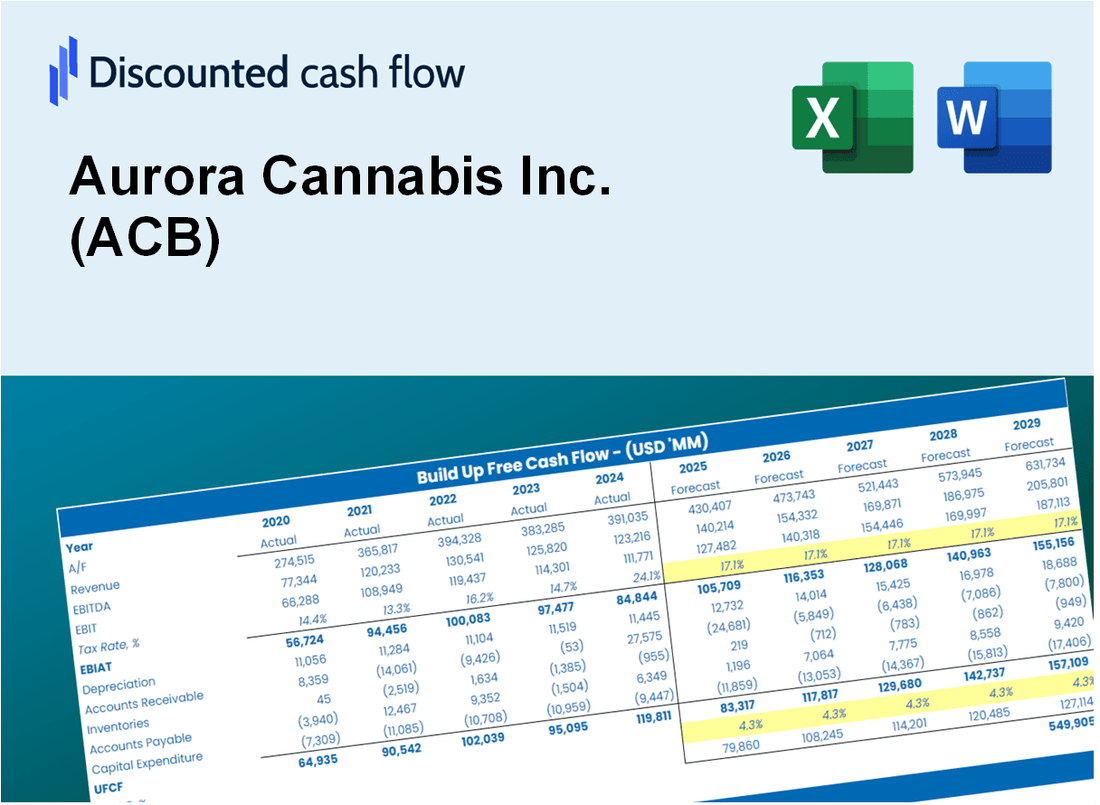
Ya sea que sea un inversionista o analista, esta calculadora DCF (ACB) es su recurso de referencia para una valoración precisa. Cargados con datos reales de Aurora Cannabis Inc., puede ajustar fácilmente los pronósticos y observar los efectos en tiempo real.
Discounted Cash Flow (DCF) - (USD MM)
| Year | AY1 2021 |
AY2 2022 |
AY3 2023 |
AY4 2024 |
AY5 2025 |
FY1 2026 |
FY2 2027 |
FY3 2028 |
FY4 2029 |
FY5 2030 |
|---|---|---|---|---|---|---|---|---|---|---|
| Revenue | 173.9 | 156.9 | 158.6 | 191.6 | 243.4 | 267.2 | 293.3 | 322.0 | 353.5 | 388.1 |
| Revenue Growth, % | 0 | -9.75 | 1.11 | 20.77 | 27.01 | 9.79 | 9.79 | 9.79 | 9.79 | 9.79 |
| EBITDA | -379.4 | -1,102.0 | -95.7 | -8.7 | 36.4 | -133.5 | -146.6 | -161.0 | -176.7 | -194.0 |
| EBITDA, % | -218.26 | -702.38 | -60.32 | -4.57 | 14.96 | -49.99 | -49.99 | -49.99 | -49.99 | -49.99 |
| Depreciation | 69.5 | 66.4 | 37.3 | 23.4 | 16.0 | 66.6 | 73.1 | 80.2 | 88.1 | 96.7 |
| Depreciation, % | 39.99 | 42.32 | 23.5 | 12.24 | 6.57 | 24.92 | 24.92 | 24.92 | 24.92 | 24.92 |
| EBIT | -449.0 | -1,168.4 | -133.0 | -32.2 | 20.4 | -156.1 | -171.4 | -188.2 | -206.6 | -226.8 |
| EBIT, % | -258.25 | -744.7 | -83.82 | -16.8 | 8.39 | -58.45 | -58.45 | -58.45 | -58.45 | -58.45 |
| Total Cash | 301.4 | 311.3 | 213.3 | 99.3 | 98.2 | 209.6 | 230.1 | 252.6 | 277.3 | 304.4 |
| Total Cash, percent | .0 | .0 | .0 | .0 | .0 | .0 | .0 | .0 | .0 | .0 |
| Account Receivables | 40.0 | 33.4 | 29.3 | 32.2 | 30.1 | 49.1 | 53.9 | 59.2 | 65.0 | 71.4 |
| Account Receivables, % | 23.03 | 21.26 | 18.47 | 16.8 | 12.37 | 18.39 | 18.39 | 18.39 | 18.39 | 18.39 |
| Inventories | 97.6 | 99.2 | 91.3 | 132.1 | 169.5 | 168.6 | 185.1 | 203.2 | 223.1 | 244.9 |
| Inventories, % | 56.15 | 63.22 | 57.56 | 68.96 | 69.65 | 63.11 | 63.11 | 63.11 | 63.11 | 63.11 |
| Accounts Payable | 9.4 | 9.8 | 15.6 | 14.4 | 19.6 | 19.8 | 21.7 | 23.9 | 26.2 | 28.8 |
| Accounts Payable, % | 5.41 | 6.26 | 9.8 | 7.52 | 8.05 | 7.41 | 7.41 | 7.41 | 7.41 | 7.41 |
| Capital Expenditure | -37.6 | -22.8 | -8.6 | -12.0 | -13.4 | -28.5 | -31.3 | -34.4 | -37.7 | -41.4 |
| Capital Expenditure, % | -21.64 | -14.55 | -5.42 | -6.27 | -5.49 | -10.68 | -10.68 | -10.68 | -10.68 | -10.68 |
| Tax Rate, % | 92.19 | 92.19 | 92.19 | 92.19 | 92.19 | 92.19 | 92.19 | 92.19 | 92.19 | 92.19 |
| EBITAT | -445.0 | -1,166.7 | -138.6 | -37.4 | 1.6 | -127.0 | -139.5 | -153.1 | -168.1 | -184.5 |
| Depreciation | ||||||||||
| Changes in Account Receivables | ||||||||||
| Changes in Inventories | ||||||||||
| Changes in Accounts Payable | ||||||||||
| Capital Expenditure | ||||||||||
| UFCF | -541.4 | -1,117.7 | -92.2 | -70.8 | -25.9 | -106.9 | -117.1 | -128.5 | -141.1 | -154.9 |
| WACC, % | 9.27 | 9.28 | 9.29 | 9.29 | 7.54 | 8.93 | 8.93 | 8.93 | 8.93 | 8.93 |
| PV UFCF | ||||||||||
| SUM PV UFCF | -497.4 | |||||||||
| Long Term Growth Rate, % | 2.00 | |||||||||
| Free cash flow (T + 1) | -158 | |||||||||
| Terminal Value | -2,279 | |||||||||
| Present Terminal Value | -1,486 | |||||||||
| Enterprise Value | -1,983 | |||||||||
| Net Debt | -24 | |||||||||
| Equity Value | -1,959 | |||||||||
| Diluted Shares Outstanding, MM | 56 | |||||||||
| Equity Value Per Share | -35.14 |
What You Will Get
- Real ACB Financials: Access to historical and projected data for precise valuation.
- Customizable Inputs: Adjust WACC, tax rates, revenue growth, and capital expenditures as needed.
- Dynamic Calculations: Intrinsic value and NPV are computed automatically.
- Scenario Analysis: Evaluate various scenarios to assess Aurora’s future performance.
- User-Friendly Design: Crafted for professionals but easy for beginners to navigate.
Key Features
- Comprehensive Data: Aurora Cannabis Inc.'s (ACB) historical financial statements and pre-populated forecasts.
- Customizable Parameters: Adjust WACC, tax rates, revenue growth, and EBITDA margins as needed.
- Real-Time Insights: Monitor Aurora's (ACB) intrinsic value recalculating instantly.
- Visual Analytics: Interactive dashboard charts present valuation results and essential metrics.
- Designed for Precision: A professional-grade tool tailored for analysts, investors, and finance professionals.
How It Works
- 1. Access the Template: Download and open the Excel file containing Aurora Cannabis Inc. (ACB)'s preloaded data.
- 2. Modify Assumptions: Adjust key inputs such as growth rates, WACC, and capital expenditures.
- 3. Analyze Results Instantly: The DCF model automatically calculates intrinsic value and NPV.
- 4. Explore Scenarios: Evaluate various forecasts to assess different valuation outcomes.
- 5. Present with Assurance: Share professional valuation insights to enhance your decision-making process.
Why Choose This Calculator for Aurora Cannabis Inc. (ACB)?
- All-in-One Solution: Features DCF, WACC, and financial ratio analyses tailored for the cannabis industry.
- Flexible Inputs: Modify yellow-highlighted cells to explore different investment scenarios.
- In-Depth Analysis: Automatically computes Aurora’s intrinsic value and Net Present Value.
- Integrated Data: Access historical and projected data for reliable analysis.
- High-Quality Standards: Perfect for financial analysts, investors, and cannabis industry consultants.
Who Should Use This Product?
- Investors: Accurately estimate Aurora Cannabis Inc.’s (ACB) fair value before making investment decisions.
- CFOs: Leverage a professional-grade DCF model for financial reporting and analysis related to Aurora Cannabis Inc. (ACB).
- Consultants: Quickly adapt the template for valuation reports tailored to clients interested in Aurora Cannabis Inc. (ACB).
- Entrepreneurs: Gain insights into financial modeling techniques used by leading companies in the cannabis industry, including Aurora Cannabis Inc. (ACB).
- Educators: Use it as a teaching tool to demonstrate valuation methodologies applicable to companies like Aurora Cannabis Inc. (ACB).
What the Template Contains
- Preloaded ACB Data: Historical and projected financial data, including revenue, EBIT, and capital expenditures.
- DCF and WACC Models: Professional-grade sheets for calculating intrinsic value and Weighted Average Cost of Capital.
- Editable Inputs: Yellow-highlighted cells for adjusting revenue growth, tax rates, and discount rates.
- Financial Statements: Comprehensive annual and quarterly financials for deeper analysis.
- Key Ratios: Profitability, leverage, and efficiency ratios to evaluate performance.
- Dashboard and Charts: Visual summaries of valuation outcomes and assumptions.
Disclaimer
All information, articles, and product details provided on this website are for general informational and educational purposes only. We do not claim any ownership over, nor do we intend to infringe upon, any trademarks, copyrights, logos, brand names, or other intellectual property mentioned or depicted on this site. Such intellectual property remains the property of its respective owners, and any references here are made solely for identification or informational purposes, without implying any affiliation, endorsement, or partnership.
We make no representations or warranties, express or implied, regarding the accuracy, completeness, or suitability of any content or products presented. Nothing on this website should be construed as legal, tax, investment, financial, medical, or other professional advice. In addition, no part of this site—including articles or product references—constitutes a solicitation, recommendation, endorsement, advertisement, or offer to buy or sell any securities, franchises, or other financial instruments, particularly in jurisdictions where such activity would be unlawful.
All content is of a general nature and may not address the specific circumstances of any individual or entity. It is not a substitute for professional advice or services. Any actions you take based on the information provided here are strictly at your own risk. You accept full responsibility for any decisions or outcomes arising from your use of this website and agree to release us from any liability in connection with your use of, or reliance upon, the content or products found herein.