
|
Valoración de DCF de Air France-Klm SA (AF.PA) |
Completamente Editable: Adáptelo A Sus Necesidades En Excel O Sheets
Diseño Profesional: Plantillas Confiables Y Estándares De La Industria
Predeterminadas Para Un Uso Rápido Y Eficiente
Compatible con MAC / PC, completamente desbloqueado
No Se Necesita Experiencia; Fáciles De Seguir
Air France-KLM SA (AF.PA) Bundle
Diseñada para la precisión, nuestra calculadora DCF de Air France-KLM SA (AFPA) le permite evaluar la valoración de Air France-KLM SA (AFPA) utilizando datos financieros del mundo real, ofreciendo una flexibilidad completa para modificar todos los parámetros clave para las proyecciones mejoradas.
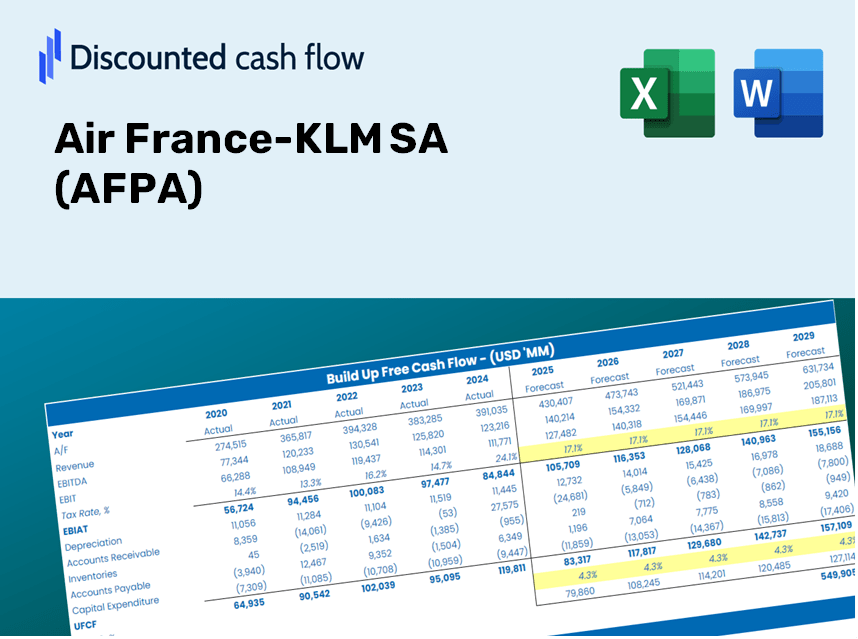
Discounted Cash Flow (DCF) - (USD MM)
| Year | AY1 2020 |
AY2 2021 |
AY3 2022 |
AY4 2023 |
AY5 2024 |
FY1 2025 |
FY2 2026 |
FY3 2027 |
FY4 2028 |
FY5 2029 |
|---|---|---|---|---|---|---|---|---|---|---|
| Revenue | 11,088.0 | 14,315.0 | 26,393.0 | 30,019.0 | 31,459.0 | 41,841.4 | 55,650.3 | 74,016.6 | 98,444.3 | 130,933.9 |
| Revenue Growth, % | 0 | 29.1 | 84.37 | 13.74 | 4.8 | 33 | 33 | 33 | 33 | 33 |
| EBITDA | -3,655.0 | -371.0 | 3,726.0 | 4,644.0 | 4,022.0 | 570.5 | 758.8 | 1,009.2 | 1,342.2 | 1,785.2 |
| EBITDA, % | -32.96 | -2.59 | 14.12 | 15.47 | 12.78 | 1.36 | 1.36 | 1.36 | 1.36 | 1.36 |
| Depreciation | 2,880.0 | 2,626.0 | 2,831.0 | 2,827.0 | 2,822.0 | 6,145.0 | 8,173.1 | 10,870.5 | 14,458.0 | 19,229.6 |
| Depreciation, % | 25.97 | 18.34 | 10.73 | 9.42 | 8.97 | 14.69 | 14.69 | 14.69 | 14.69 | 14.69 |
| EBIT | -6,535.0 | -2,997.0 | 895.0 | 1,817.0 | 1,200.0 | -5,574.6 | -7,414.3 | -9,861.3 | -13,115.8 | -17,444.4 |
| EBIT, % | -58.94 | -20.94 | 3.39 | 6.05 | 3.81 | -13.32 | -13.32 | -13.32 | -13.32 | -13.32 |
| Total Cash | 6,708.0 | 6,805.0 | 7,232.0 | 7,384.0 | 5,983.0 | 14,983.6 | 19,928.7 | 26,505.8 | 35,253.5 | 46,888.2 |
| Total Cash, percent | .0 | .0 | .0 | .0 | .0 | .0 | .0 | .0 | .0 | .0 |
| Account Receivables | 1,942.0 | 2,184.0 | 2,306.0 | 2,152.0 | 2,559.0 | 4,754.1 | 6,323.2 | 8,410.0 | 11,185.5 | 14,877.1 |
| Account Receivables, % | 17.51 | 15.26 | 8.74 | 7.17 | 8.13 | 11.36 | 11.36 | 11.36 | 11.36 | 11.36 |
| Inventories | 543.0 | 567.0 | 723.0 | 853.0 | 959.0 | 1,463.4 | 1,946.4 | 2,588.7 | 3,443.1 | 4,579.4 |
| Inventories, % | 4.9 | 3.96 | 2.74 | 2.84 | 3.05 | 3.5 | 3.5 | 3.5 | 3.5 | 3.5 |
| Accounts Payable | 1,435.0 | 1,850.0 | 2,424.0 | 2,447.0 | 2,608.0 | 4,308.9 | 5,731.0 | 7,622.4 | 10,138.1 | 13,483.9 |
| Accounts Payable, % | 12.94 | 12.92 | 9.18 | 8.15 | 8.29 | 10.3 | 10.3 | 10.3 | 10.3 | 10.3 |
| Capital Expenditure | -2,099.0 | -2,202.0 | -2,972.0 | -3,551.0 | -3,728.0 | -5,795.3 | -7,707.9 | -10,251.7 | -13,635.1 | -18,135.1 |
| Capital Expenditure, % | -18.93 | -15.38 | -11.26 | -11.83 | -11.85 | -13.85 | -13.85 | -13.85 | -13.85 | -13.85 |
| Tax Rate, % | 44.68 | 44.68 | 44.68 | 44.68 | 44.68 | 44.68 | 44.68 | 44.68 | 44.68 | 44.68 |
| EBITAT | -6,626.5 | -2,758.9 | 1,905.1 | 1,479.6 | 663.9 | -4,780.8 | -6,358.6 | -8,457.2 | -11,248.3 | -14,960.6 |
| Depreciation | ||||||||||
| Changes in Account Receivables | ||||||||||
| Changes in Inventories | ||||||||||
| Changes in Accounts Payable | ||||||||||
| Capital Expenditure | ||||||||||
| UFCF | -6,895.5 | -2,185.9 | 2,060.1 | 802.6 | -594.1 | -5,429.7 | -6,523.3 | -8,676.2 | -11,539.6 | -15,348.1 |
| WACC, % | 4.9 | 4.61 | 4.9 | 4.23 | 3.3 | 4.39 | 4.39 | 4.39 | 4.39 | 4.39 |
| PV UFCF | ||||||||||
| SUM PV UFCF | -40,918.2 | |||||||||
| Long Term Growth Rate, % | 2.00 | |||||||||
| Free cash flow (T + 1) | -15,655 | |||||||||
| Terminal Value | -656,037 | |||||||||
| Present Terminal Value | -529,311 | |||||||||
| Enterprise Value | -570,229 | |||||||||
| Net Debt | 9,705 | |||||||||
| Equity Value | -579,934 | |||||||||
| Diluted Shares Outstanding, MM | 263 | |||||||||
| Equity Value Per Share | -2,208.21 |
What You Will Receive
- Flexible Forecast Inputs: Effortlessly adjust parameters (growth %, margins, WACC) to explore various scenarios.
- Market Data Insights: Air France-KLM’s financial information pre-filled to enhance your analysis.
- Automated DCF Calculations: The template calculates Net Present Value (NPV) and intrinsic value automatically.
- Customizable and Professional Design: A refined Excel model tailored to your valuation requirements.
- Designed for Analysts and Investors: Perfect for evaluating forecasts, confirming strategies, and increasing efficiency.
Key Features
- Pre-Loaded Data: Historical financial statements and pre-filled forecasts for Air France-KLM SA (AFPA).
- Fully Adjustable Inputs: Customize WACC, tax rates, revenue growth, and EBITDA margins.
- Instant Results: View real-time recalculations of Air France-KLM's intrinsic value.
- Clear Visual Outputs: Dashboard charts showcase valuation results and key performance indicators.
- Built for Accuracy: A professional-grade tool tailored for analysts, investors, and finance professionals.
How It Works
- Step 1: Download the ready-to-use Excel template featuring Air France-KLM SA’s (AFPA) data.
- Step 2: Review the pre-populated sheets to familiarize yourself with the essential metrics.
- Step 3: Modify forecasts and assumptions in the editable yellow cells (WACC, growth, margins).
- Step 4: Instantly see recalculated results, including Air France-KLM SA’s (AFPA) intrinsic value.
- Step 5: Utilize the outputs to make informed investment decisions or create detailed reports.
Why Choose This Calculator for Air France-KLM SA (AFPA)?
- Accurate Data: Utilizes real financial data from Air France-KLM SA for trustworthy valuation outcomes.
- Customizable: Tailor essential parameters such as growth rates, WACC, and tax rates to align with your forecasts.
- Time-Saving: Built-in calculations save you from starting from the ground up.
- Professional-Grade Tool: Crafted specifically for investors, analysts, and consultants in the aviation sector.
- User-Friendly: Features an intuitive design and clear, step-by-step guidance for users of all levels.
Who Should Utilize This Product?
- Investors: Assess Air France-KLM’s valuation prior to making stock trades.
- CFOs and Financial Analysts: Optimize valuation workflows and evaluate financial projections.
- Startup Founders: Gain insights into how large public entities like Air France-KLM are valued.
- Consultants: Produce detailed valuation reports for your clientele.
- Students and Educators: Leverage real-time data for teaching and practicing valuation methodologies.
Contents of the Template
- Detailed DCF Model: An editable template featuring comprehensive valuation calculations.
- Relevant Financial Data: Air France-KLM SA's (AFPA) historical and projected financials preloaded for in-depth analysis.
- Flexible Assumptions: Tailor WACC, growth rates, and tax assumptions to explore various scenarios.
- Full Financial Statements: Complete annual and quarterly breakdowns for enhanced insights.
- Essential Ratios: Integrated analysis for profitability, efficiency, and leverage metrics.
- Visual Dashboard: Graphs and tables to present clear and actionable findings.
Disclaimer
All information, articles, and product details provided on this website are for general informational and educational purposes only. We do not claim any ownership over, nor do we intend to infringe upon, any trademarks, copyrights, logos, brand names, or other intellectual property mentioned or depicted on this site. Such intellectual property remains the property of its respective owners, and any references here are made solely for identification or informational purposes, without implying any affiliation, endorsement, or partnership.
We make no representations or warranties, express or implied, regarding the accuracy, completeness, or suitability of any content or products presented. Nothing on this website should be construed as legal, tax, investment, financial, medical, or other professional advice. In addition, no part of this site—including articles or product references—constitutes a solicitation, recommendation, endorsement, advertisement, or offer to buy or sell any securities, franchises, or other financial instruments, particularly in jurisdictions where such activity would be unlawful.
All content is of a general nature and may not address the specific circumstances of any individual or entity. It is not a substitute for professional advice or services. Any actions you take based on the information provided here are strictly at your own risk. You accept full responsibility for any decisions or outcomes arising from your use of this website and agree to release us from any liability in connection with your use of, or reliance upon, the content or products found herein.