
|
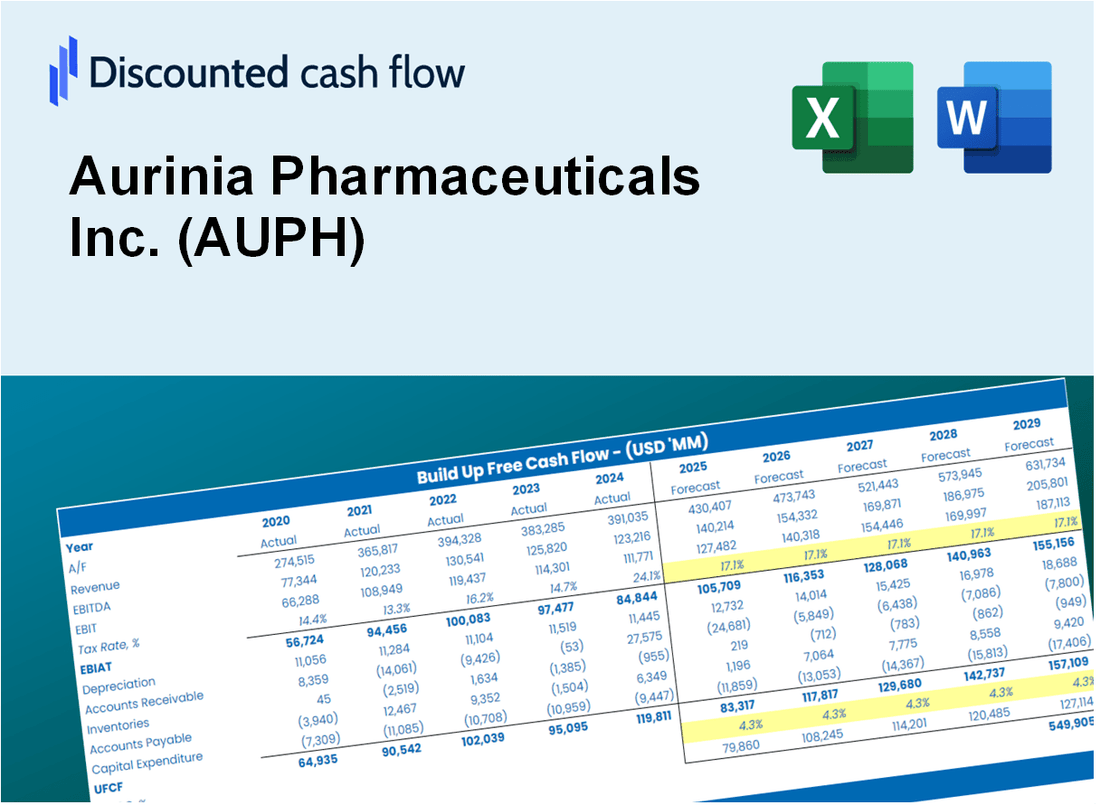
Valoración DCF de Aurinia Pharmaceuticals Inc. (AUPH) |
Completamente Editable: Adáptelo A Sus Necesidades En Excel O Sheets
Diseño Profesional: Plantillas Confiables Y Estándares De La Industria
Predeterminadas Para Un Uso Rápido Y Eficiente
Compatible con MAC / PC, completamente desbloqueado
No Se Necesita Experiencia; Fáciles De Seguir
Aurinia Pharmaceuticals Inc. (AUPH) Bundle
¿Busca evaluar el valor intrínseco de Aurinia Pharmaceuticals Inc.? Nuestra calculadora AUPH DCF integra datos en tiempo real con extensas características de personalización, lo que le permite ajustar los pronósticos y mejorar sus opciones de inversión.
Discounted Cash Flow (DCF) - (USD MM)
| Year | AY1 2020 |
AY2 2021 |
AY3 2022 |
AY4 2023 |
AY5 2024 |
FY1 2025 |
FY2 2026 |
FY3 2027 |
FY4 2028 |
FY5 2029 |
|---|---|---|---|---|---|---|---|---|---|---|
| Revenue | 50.1 | 45.6 | 134.0 | 175.5 | 235.1 | 326.8 | 454.2 | 631.2 | 877.2 | 1,219.1 |
| Revenue Growth, % | 0 | -9 | 193.89 | 30.95 | 33.97 | 38.98 | 38.98 | 38.98 | 38.98 | 38.98 |
| EBITDA | -102.9 | -177.4 | -103.6 | -63.0 | 31.7 | -195.9 | -272.3 | -378.4 | -525.9 | -730.9 |
| EBITDA, % | -205.35 | -389.09 | -77.33 | -35.92 | 13.49 | -59.95 | -59.95 | -59.95 | -59.95 | -59.95 |
| Depreciation | 1.4 | 2.8 | 2.7 | 11.6 | 19.4 | 16.8 | 23.4 | 32.5 | 45.1 | 62.7 |
| Depreciation, % | 2.74 | 6.05 | 2.02 | 6.64 | 8.27 | 5.14 | 5.14 | 5.14 | 5.14 | 5.14 |
| EBIT | -104.3 | -180.2 | -106.4 | -74.7 | 12.3 | -207.0 | -287.7 | -399.8 | -555.6 | -772.2 |
| EBIT, % | -208.09 | -395.15 | -79.35 | -42.56 | 5.22 | -63.34 | -63.34 | -63.34 | -63.34 | -63.34 |
| Total Cash | 398.3 | 466.1 | 389.4 | 350.5 | 358.5 | 326.8 | 454.2 | 631.2 | 877.2 | 1,219.1 |
| Total Cash, percent | .0 | .0 | .0 | .0 | .0 | .0 | .0 | .0 | .0 | .0 |
| Account Receivables | .0 | 15.4 | 13.5 | 24.1 | 36.5 | 47.8 | 66.4 | 92.3 | 128.3 | 178.3 |
| Account Receivables, % | 0 | 33.8 | 10.06 | 13.72 | 15.54 | 14.63 | 14.63 | 14.63 | 14.63 | 14.63 |
| Inventories | 13.9 | 19.3 | 24.8 | 39.7 | 39.2 | 83.6 | 116.2 | 161.5 | 224.5 | 312.0 |
| Inventories, % | 27.79 | 42.38 | 18.47 | 22.62 | 16.68 | 25.59 | 25.59 | 25.59 | 25.59 | 25.59 |
| Accounts Payable | 2.6 | 3.9 | 3.1 | 4.3 | 5.2 | 13.6 | 18.8 | 26.2 | 36.4 | 50.6 |
| Accounts Payable, % | 5.26 | 8.51 | 2.3 | 2.47 | 2.21 | 4.15 | 4.15 | 4.15 | 4.15 | 4.15 |
| Capital Expenditure | -7.3 | -1.5 | -.3 | -.7 | -.3 | -12.2 | -17.0 | -23.6 | -32.8 | -45.6 |
| Capital Expenditure, % | -14.65 | -3.29 | -0.21786 | -0.40909 | -0.11951 | -3.74 | -3.74 | -3.74 | -3.74 | -3.74 |
| Tax Rate, % | 22.77 | 22.77 | 22.77 | 22.77 | 22.77 | 22.77 | 22.77 | 22.77 | 22.77 | 22.77 |
| EBITAT | -104.2 | -181.0 | -108.2 | -75.2 | 9.5 | -197.5 | -274.5 | -381.5 | -530.2 | -736.9 |
| Depreciation | ||||||||||
| Changes in Account Receivables | ||||||||||
| Changes in Inventories | ||||||||||
| Changes in Accounts Payable | ||||||||||
| Capital Expenditure | ||||||||||
| UFCF | -121.5 | -199.3 | -110.1 | -88.6 | 17.5 | -240.2 | -314.1 | -436.5 | -606.6 | -843.0 |
| WACC, % | 10.46 | 10.46 | 10.46 | 10.46 | 10.42 | 10.45 | 10.45 | 10.45 | 10.45 | 10.45 |
| PV UFCF | ||||||||||
| SUM PV UFCF | -1,719.2 | |||||||||
| Long Term Growth Rate, % | 2.00 | |||||||||
| Free cash flow (T + 1) | -860 | |||||||||
| Terminal Value | -10,173 | |||||||||
| Present Terminal Value | -6,188 | |||||||||
| Enterprise Value | -7,907 | |||||||||
| Net Debt | -4 | |||||||||
| Equity Value | -7,903 | |||||||||
| Diluted Shares Outstanding, MM | 146 | |||||||||
| Equity Value Per Share | -54.06 |
What You Will Get
- Comprehensive AUPH Financials: Access historical and projected data for precise valuation.
- Customizable Inputs: Adjust WACC, tax rates, revenue growth, and capital expenditures as needed.
- Dynamic Calculations: Intrinsic value and NPV are computed in real-time.
- Scenario Analysis: Explore various scenarios to assess Aurinia’s future performance.
- User-Friendly Interface: Designed for professionals while remaining approachable for newcomers.
Key Features
- Comprehensive Data: Aurinia Pharmaceuticals Inc.'s historical financial statements and pre-filled forecasts.
- Customizable Inputs: Adjust WACC, tax rates, revenue growth, and EBITDA margins as needed.
- Real-Time Insights: Observe Aurinia's intrinsic value recalculating instantly.
- Intuitive Visuals: Dashboard charts present valuation results and essential metrics clearly.
- Designed for Precision: A professional-grade tool tailored for analysts, investors, and finance specialists.
How It Works
- Step 1: Download the Excel file.
- Step 2: Review pre-entered Aurinia Pharmaceuticals Inc. (AUPH) data (historical and projected).
- Step 3: Adjust key assumptions (yellow cells) based on your analysis.
- Step 4: View automatic recalculations for Aurinia Pharmaceuticals Inc.'s (AUPH) intrinsic value.
- Step 5: Use the outputs for investment decisions or reporting.
Why Choose Aurinia Pharmaceuticals Inc. (AUPH)?
- Innovative Solutions: Pioneering therapies that address unmet medical needs in kidney diseases.
- Strong Pipeline: Robust research and development efforts aimed at delivering impactful treatments.
- Expert Team: Led by industry veterans with extensive experience in pharmaceuticals and biotechnology.
- Commitment to Quality: Adherence to the highest standards in clinical trials and product development.
- Proven Track Record: Demonstrated success in bringing effective therapies to market.
Who Should Use This Product?
- Individual Investors: Make informed decisions about buying or selling Aurinia Pharmaceuticals Inc. (AUPH) stock.
- Financial Analysts: Streamline valuation processes with ready-to-use financial models for Aurinia Pharmaceuticals Inc. (AUPH).
- Consultants: Deliver professional valuation insights on Aurinia Pharmaceuticals Inc. (AUPH) to clients quickly and accurately.
- Business Owners: Understand how biotech companies like Aurinia Pharmaceuticals Inc. (AUPH) are valued to guide your own strategy.
- Finance Students: Learn valuation techniques using real-world data and scenarios related to Aurinia Pharmaceuticals Inc. (AUPH).
What the Template Contains
- Historical Data: Includes Aurinia Pharmaceuticals Inc.'s (AUPH) past financials and baseline forecasts.
- DCF and Levered DCF Models: Detailed templates to calculate Aurinia Pharmaceuticals Inc.'s (AUPH) intrinsic value.
- WACC Sheet: Pre-built calculations for Weighted Average Cost of Capital.
- Editable Inputs: Modify key drivers like growth rates, EBITDA %, and CAPEX assumptions.
- Quarterly and Annual Statements: A complete breakdown of Aurinia Pharmaceuticals Inc.'s (AUPH) financials.
- Interactive Dashboard: Visualize valuation results and projections dynamically.
Disclaimer
All information, articles, and product details provided on this website are for general informational and educational purposes only. We do not claim any ownership over, nor do we intend to infringe upon, any trademarks, copyrights, logos, brand names, or other intellectual property mentioned or depicted on this site. Such intellectual property remains the property of its respective owners, and any references here are made solely for identification or informational purposes, without implying any affiliation, endorsement, or partnership.
We make no representations or warranties, express or implied, regarding the accuracy, completeness, or suitability of any content or products presented. Nothing on this website should be construed as legal, tax, investment, financial, medical, or other professional advice. In addition, no part of this site—including articles or product references—constitutes a solicitation, recommendation, endorsement, advertisement, or offer to buy or sell any securities, franchises, or other financial instruments, particularly in jurisdictions where such activity would be unlawful.
All content is of a general nature and may not address the specific circumstances of any individual or entity. It is not a substitute for professional advice or services. Any actions you take based on the information provided here are strictly at your own risk. You accept full responsibility for any decisions or outcomes arising from your use of this website and agree to release us from any liability in connection with your use of, or reliance upon, the content or products found herein.