
|
Valoración DCF de BancFirst Corporation (BANF) |
Completamente Editable: Adáptelo A Sus Necesidades En Excel O Sheets
Diseño Profesional: Plantillas Confiables Y Estándares De La Industria
Predeterminadas Para Un Uso Rápido Y Eficiente
Compatible con MAC / PC, completamente desbloqueado
No Se Necesita Experiencia; Fáciles De Seguir
BancFirst Corporation (BANF) Bundle
¡Evalúe la perspectiva financiera de Bancfirst Corporation como un experto! Esta calculadora DCF (BANF) le proporciona finanzas preladas y flexibilidad completa para modificar el crecimiento de los ingresos, WACC, los márgenes y otros supuestos esenciales para alinearse con sus proyecciones.
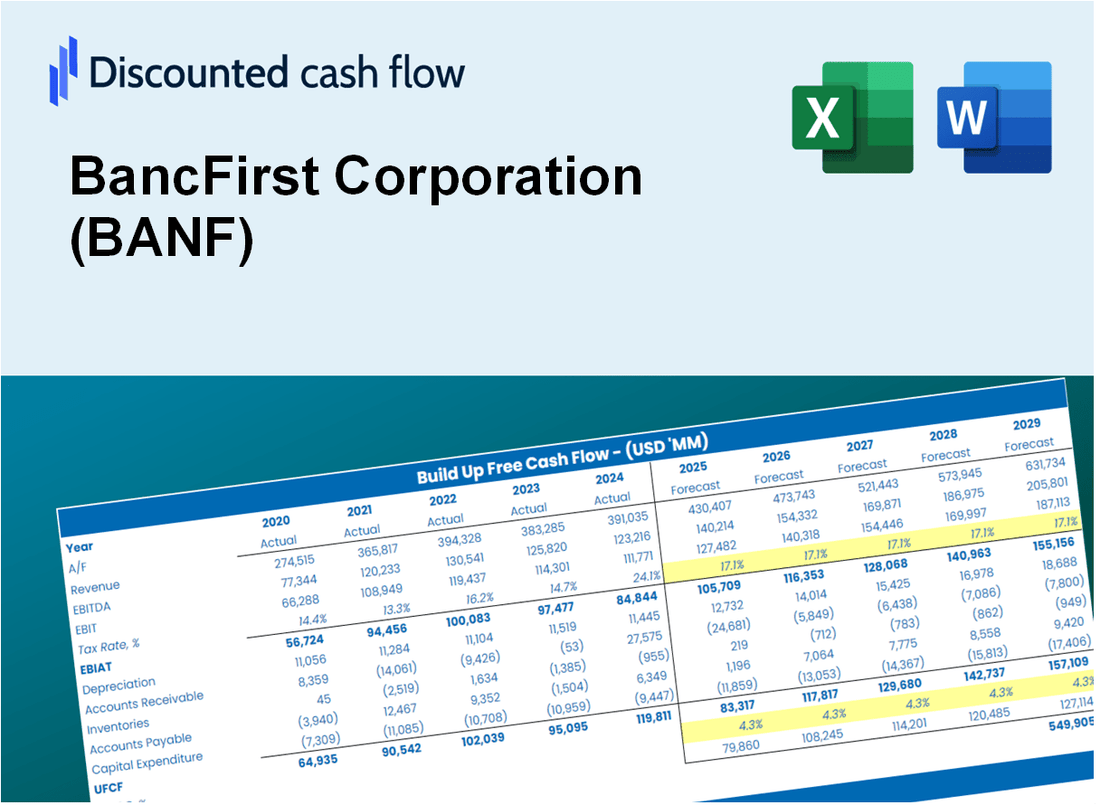
Discounted Cash Flow (DCF) - (USD MM)
| Year | AY1 2020 |
AY2 2021 |
AY3 2022 |
AY4 2023 |
AY5 2024 |
FY1 2025 |
FY2 2026 |
FY3 2027 |
FY4 2028 |
FY5 2029 |
|---|---|---|---|---|---|---|---|---|---|---|
| Revenue | 464.3 | 497.1 | 603.6 | 809.3 | 908.7 | 1,078.7 | 1,280.6 | 1,520.2 | 1,804.7 | 2,142.4 |
| Revenue Growth, % | 0 | 7.05 | 21.43 | 34.09 | 12.28 | 18.71 | 18.71 | 18.71 | 18.71 | 18.71 |
| EBITDA | 141.9 | 228.4 | 259.5 | 292.1 | 297.0 | 406.2 | 482.3 | 572.5 | 679.6 | 806.8 |
| EBITDA, % | 30.57 | 45.96 | 42.99 | 36.1 | 32.68 | 37.66 | 37.66 | 37.66 | 37.66 | 37.66 |
| Depreciation | 18.4 | 20.0 | 22.0 | 22.2 | 21.7 | 36.2 | 43.0 | 51.0 | 60.6 | 71.9 |
| Depreciation, % | 3.97 | 4.03 | 3.65 | 2.74 | 2.39 | 3.36 | 3.36 | 3.36 | 3.36 | 3.36 |
| EBIT | 123.5 | 208.4 | 237.4 | 269.9 | 275.3 | 370.0 | 439.3 | 521.5 | 619.0 | 734.9 |
| EBIT, % | 26.6 | 41.93 | 39.34 | 33.35 | 30.29 | 34.3 | 34.3 | 34.3 | 34.3 | 34.3 |
| Total Cash | 2,169.1 | 2,581.5 | 4,707.1 | 3,951.4 | 3,883.7 | 1,078.7 | 1,280.6 | 1,520.2 | 1,804.7 | 2,142.4 |
| Total Cash, percent | .0 | .0 | .0 | .0 | .0 | .0 | .0 | .0 | .0 | .0 |
| Account Receivables | 220.6 | 234.0 | 301.6 | .0 | .0 | 311.9 | 370.2 | 439.5 | 521.7 | 619.4 |
| Account Receivables, % | 47.51 | 47.08 | 49.96 | 0 | 0 | 28.91 | 28.91 | 28.91 | 28.91 | 28.91 |
| Inventories | .0 | .0 | .0 | .0 | .0 | .0 | .0 | .0 | .0 | .0 |
| Inventories, % | 0 | 0 | 0 | 0 | 0 | 0 | 0 | 0 | 0 | 0 |
| Accounts Payable | 51.9 | 56.0 | 76.5 | .0 | .0 | 75.7 | 89.9 | 106.7 | 126.7 | 150.4 |
| Accounts Payable, % | 11.17 | 11.26 | 12.67 | 0 | 0 | 7.02 | 7.02 | 7.02 | 7.02 | 7.02 |
| Capital Expenditure | -66.4 | -27.3 | -19.8 | -22.5 | -36.7 | -64.5 | -76.5 | -90.9 | -107.9 | -128.0 |
| Capital Expenditure, % | -14.31 | -5.48 | -3.28 | -2.78 | -4.03 | -5.98 | -5.98 | -5.98 | -5.98 | -5.98 |
| Tax Rate, % | 21.41 | 21.41 | 21.41 | 21.41 | 21.41 | 21.41 | 21.41 | 21.41 | 21.41 | 21.41 |
| EBITAT | 99.6 | 167.6 | 193.1 | 212.5 | 216.4 | 295.8 | 351.2 | 416.9 | 494.9 | 587.5 |
| Depreciation | ||||||||||
| Changes in Account Receivables | ||||||||||
| Changes in Inventories | ||||||||||
| Changes in Accounts Payable | ||||||||||
| Capital Expenditure | ||||||||||
| UFCF | -117.2 | 151.1 | 148.3 | 437.2 | 201.4 | 31.4 | 273.4 | 324.6 | 385.3 | 457.4 |
| WACC, % | 12.61 | 12.6 | 12.67 | 12.47 | 12.47 | 12.56 | 12.56 | 12.56 | 12.56 | 12.56 |
| PV UFCF | ||||||||||
| SUM PV UFCF | 964.3 | |||||||||
| Long Term Growth Rate, % | 2.00 | |||||||||
| Free cash flow (T + 1) | 467 | |||||||||
| Terminal Value | 4,416 | |||||||||
| Present Terminal Value | 2,444 | |||||||||
| Enterprise Value | 3,408 | |||||||||
| Net Debt | -3,468 | |||||||||
| Equity Value | 6,876 | |||||||||
| Diluted Shares Outstanding, MM | 34 | |||||||||
| Equity Value Per Share | 204.53 |
What You Will Get
- Editable Forecast Inputs: Easily modify assumptions (growth %, margins, WACC) to explore various scenarios.
- Real-World Data: BancFirst Corporation’s financial data pre-filled to accelerate your analysis.
- Automatic DCF Outputs: The template computes Net Present Value (NPV) and intrinsic value for you.
- Customizable and Professional: A refined Excel model that adjusts to your valuation requirements.
- Built for Analysts and Investors: Perfect for testing projections, validating strategies, and enhancing efficiency.
Key Features
- Comprehensive Historical Data: BancFirst Corporation’s (BANF) detailed financial statements and historical forecasts.
- Customizable Parameters: Adjust WACC, tax rates, revenue growth, and EBITDA margins as needed.
- Real-Time Valuation: Instantly view BancFirst Corporation’s (BANF) intrinsic value recalculating as inputs change.
- Intuitive Visualizations: Dashboard graphs illustrate valuation outcomes and essential metrics.
- Designed for Precision: A reliable tool tailored for analysts, investors, and finance professionals.
How It Works
- Download the Template: Gain immediate access to the Excel-based BANF DCF Calculator.
- Input Your Assumptions: Modify the yellow-highlighted cells for growth rates, WACC, margins, and other variables.
- Instant Calculations: The model will automatically refresh BancFirst Corporation’s intrinsic value.
- Test Scenarios: Explore various assumptions to assess potential changes in valuation.
- Analyze and Decide: Utilize the findings to inform your investment or financial assessments.
Why Choose BancFirst Corporation (BANF)?
- Time Efficiency: Quickly access banking services without the hassle of lengthy processes.
- Enhanced Accuracy: Dependable financial insights ensure informed decision-making.
- Customizable Solutions: Tailor banking products to meet your unique financial needs.
- User-Friendly Experience: Intuitive interfaces simplify transactions and account management.
- Expertly Endorsed: Preferred by professionals for its reliability and customer service.
Who Should Use This Product?
- Professional Investors: Create comprehensive and trustworthy valuation models for analyzing BancFirst Corporation (BANF).
- Corporate Finance Teams: Evaluate valuation scenarios to inform internal decision-making processes.
- Consultants and Advisors: Deliver precise valuation insights to clients regarding BancFirst Corporation (BANF).
- Students and Educators: Utilize real-world data to enhance learning and practice in financial modeling.
- Banking Enthusiasts: Gain insights into how banking institutions like BancFirst Corporation (BANF) are valued in the financial market.
What the Template Contains
- Preloaded BANF Data: Historical and projected financial data, including revenue, EBIT, and capital expenditures.
- DCF and WACC Models: Professional-grade sheets for calculating intrinsic value and Weighted Average Cost of Capital.
- Editable Inputs: Yellow-highlighted cells for adjusting revenue growth, tax rates, and discount rates.
- Financial Statements: Comprehensive annual and quarterly financials for deeper analysis.
- Key Ratios: Profitability, leverage, and efficiency ratios to evaluate performance.
- Dashboard and Charts: Visual summaries of valuation outcomes and assumptions.
Disclaimer
All information, articles, and product details provided on this website are for general informational and educational purposes only. We do not claim any ownership over, nor do we intend to infringe upon, any trademarks, copyrights, logos, brand names, or other intellectual property mentioned or depicted on this site. Such intellectual property remains the property of its respective owners, and any references here are made solely for identification or informational purposes, without implying any affiliation, endorsement, or partnership.
We make no representations or warranties, express or implied, regarding the accuracy, completeness, or suitability of any content or products presented. Nothing on this website should be construed as legal, tax, investment, financial, medical, or other professional advice. In addition, no part of this site—including articles or product references—constitutes a solicitation, recommendation, endorsement, advertisement, or offer to buy or sell any securities, franchises, or other financial instruments, particularly in jurisdictions where such activity would be unlawful.
All content is of a general nature and may not address the specific circumstances of any individual or entity. It is not a substitute for professional advice or services. Any actions you take based on the information provided here are strictly at your own risk. You accept full responsibility for any decisions or outcomes arising from your use of this website and agree to release us from any liability in connection with your use of, or reliance upon, the content or products found herein.